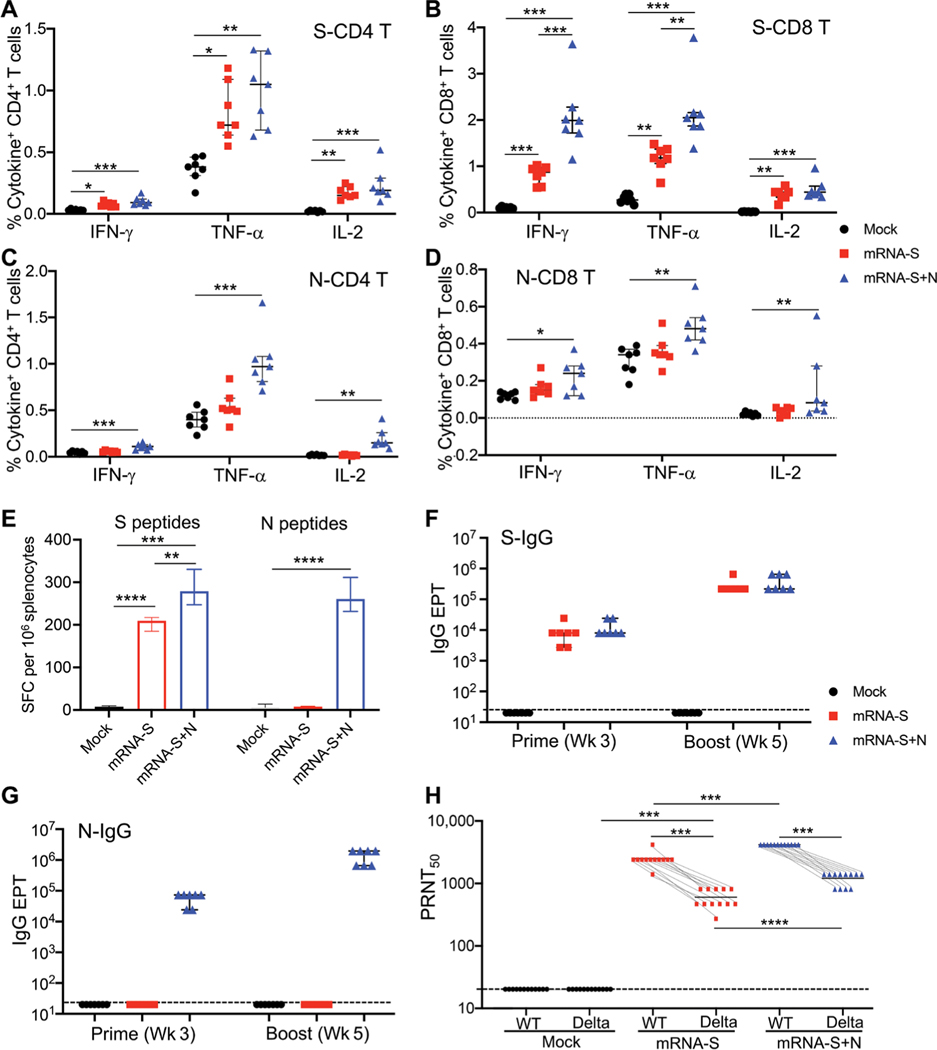
Fig. 5. Combination mRNA-S+N vaccination induces antigen-specific immune responses in mice and hamsters.
Immunogenicity experimental design and timeline: Three groups of BALB/c mice (n = 7 per group) were vaccinated intramuscularly with mock, mRNA-S (1 μg), or combination mRNA-S+N (1 μg for each) at weeks 0 and 3. Blood and serum samples were collected at week 3 (before booster) to measure antibody responses. Two weeks after booster (week 5), vaccine-induced T cell and antibody responses were measured. (A and B) ICS measurements of S-specific CD4+ and CD8+ T cells in the mouse spleen (week 5) are shown. Percent of individual cytokine-positive CD4+ (A) or CD8+ (B) T cells were compared between the mock and vaccine groups. (C and D) ICS measurements of N-specific CD4+ and CD8+ T cells in the mouse spleen (week 5) are shown. Percent of individual cytokine-positive CD4+ (C) or CD8+ (D) T cells were compared between the mock and vaccine groups. (E) IFN-γ ELISPOT measurements of antigen- specific T cells in spleen (week 5) are shown. Data were shown as SFC per 106 splenocytes. (F and G) ELISA measurement of serum S-specific (F) or N-specific (G) binding IgG are shown for samples collected after prime (week 3) or booster (week 5) vaccination in mice. Antibody EPTs were determined on the basis of serum serial dilutions and compared between different groups. (H) Serum samples were collected from the hamsters in Fig. 3D (n = 12) after booster vaccination (week 5) but before viral challenge. Samples were used to measure neutralizing activity by PRNT. PRNT50 neutralization titers for individual serum samples were compared among different groups and between the wild-type virus and the Delta variants. Dashed lines (F, G, and H) show limit of detection for each assay. Data are presented as median and IQR where appropriate. Kruskal-Wallis test was used for statistical analysis. *P < 0.05, **P < 0.01, ***P < 0.001, and ****P < 0.0001.

