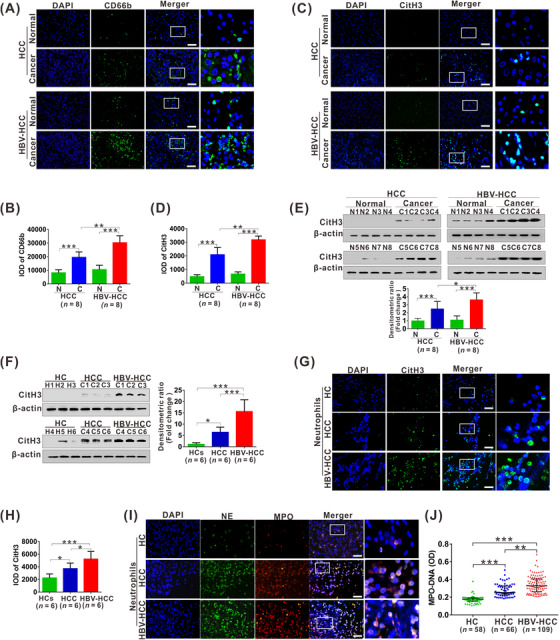
FIGURE 1.

NETs levels are elevated in HCC, especially in HBV‐positive HCC. (A‐B) The representative images of IF staining for CD66b (A) in tissue sections from HCC patients, HBV‐HCC patients and their matched para‐carcinoma tissues. The IOD of CD66b (B) IF‐stained materials were analyzed utilizing the Image Pro Plus software. Data from histomorphometric analysis are presented as mean ± standard deviation calculated from 8 HCC patients, 8 HBV‐HCC patients and their matched para‐carcinoma tissues. (C‐D) The representative images of IF staining for CitH3 (C) in tissue sections from HCC patients, HBV‐HCC patients and their matched para‐carcinoma tissues. The IOD of CitH3 (D) IF‐stained materials were analyzed utilizing the Image Pro Plus software. Data from histomorphometric analysis are presented as mean ± standard deviation calculated from 8 HCC patients, 8 HBV‐HCC patients and their matched para‐carcinoma tissues. (E) Western blot analysis for CitH3 expression in tissue sections from 8 HCC patients, 8 HBV‐HCC patients and their matched para‐carcinoma tissues. The fold change of densitometric ratios was normalized to the β‐actin and then compared to the control and was shown on the below panel. (F) Western blot analysis for CitH3 expression in peripheral neutrophils from 6 healthy controls, 6 HCC patients and 6 HBV‐HCC patients. The fold change of densitometric ratios was normalized to the β‐actin and then compared to the control and was shown on the right panel. (G) The representative images of IF staining for CitH3 in human neutrophils from healthy controls, HCC patients and HBV‐HCC patients. (H) The IOD of CitH3 IF‐stained materials were analyzed utilizing the Image Pro Plus software. Data from histomorphometric analysis are presented as mean ± standard deviation calculated from 6 healthy controls, 6 HCC patients and 6 HBV‐HCC patients. (I) The representative images of IF staining for DNA/NE/MPO in human neutrophils from healthy controls, HCC patients and HBV‐HCC patients. (J) ELISA analysis for serum levels of MPO‐DNA (serum marker for NETs) in healthy controls, HCC patients and HBV‐HCC patients. White scale bars: 50 μm. *P < 0.05, **P < 0.01, ***P < 0.001. Abbreviations: HCC, HBV‐negative hepatocellular carcinoma; HBV‐HCC, HBV‐positive hepatocellular carcinoma; IOD, integrated optical density; DAPI, 4’, 6‐diamidino‐2‐phenylindole; CitH3, citrullinated modification of histone 3; NE, neutrophil elastase; MPO, myeloperoxidase; IF, immunofluorescence; N, normal; C, cancer; HC, healthy controls.
