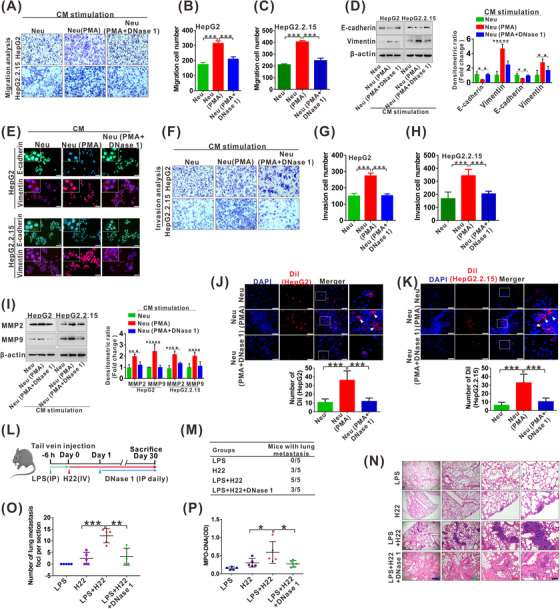
FIGURE 3.

NETs facilitate metastasis of HCC. (A‐C) Transwell migration assay for HepG2 and HepG2.2.15 cells treated with CM (Neu), CM (Neu + PMA) or CM (Neu + PMA + DNase 1) for 48 h (A). The number of transmembrane cells is quantified (B‐C). (D) Western blot analysis for expression of E‐cadherin and vimentin in HepG2 and HepG2.2.15 cells treated with CM (Neu), CM (Neu + PMA) or CM (Neu + PMA + DNase 1) for 48 h. The fold change of densitometric ratios was normalized to the β‐actin and then compared to the control and was shown on the right panel. (E) The representative images of IF staining for E‐cadherin and vimentin in HepG2 and HepG2.2.15 cells treated with CM (Neu), CM (Neu + PMA) or CM (Neu + PMA + DNase 1) for 48 h. White scale bars: 50 μm. (F‐H) Transwell invasion assay for HepG2 and HepG2.2.15 cells treated with CM (Neu), CM (Neu + PMA) or CM (Neu + PMA + DNase 1) for 48 h (F). The number of transmembrane cells is quantified (G‐H). (I) Western blot analysis for MMP2 and MMP9 in HepG2 and HepG2.2.15 cells treated with CM (Neu), CM (Neu + PMA) or CM (Neu + PMA + DNase 1) for 48 h. The fold change of densitometric ratios was normalized to the β‐actin and then compared to the control and was shown on the right panel. (J‐K) Representative fluorescence images of adhesion assay for Dil‐labled HepG2 (J) and HepG2.2.15 (K) cells trapped within PMA or DNase 1‐treated neutrophils. White scale bars: 50 μm. The number of Dil‐labled HepG2 and HepG2.2.15 cells is quantified and shown on the below, respectively. (L) The schematic diagram of the HCC metastasis mice model. (M) The total number of mice with distant lung metastasis after injection of LPS, H22, LPS + H22 or LPS + H22 + DNase 1 for 30 days. (N) Representative HE staining of lung tissue sections from groups of LPS, H22, LPS + H22 and LPS + H22 + DNase 1. Black scale bars, 200 μm; Red scale bars, 400 μm; Green scale bars, 800 μm; Blue scale bars, 2000 μm. (O) The number of metastasis foci per section in lungs from individual mice with an injection of LPS, H22, LPS + H22 or LPS + H22 + DNase 1. (P) ELISA analysis for serum levels of MPO‐DNA in mice after injection of LPS, H22, LPS + H22 or LPS + H22 + DNase 1 for 30 days. *P < 0.05, **P < 0.01, ***P < 0.001. Abbreviations: IP, intraperitoneal injection; IV, intravenous injection; LPS, lipopolysaccharide.
