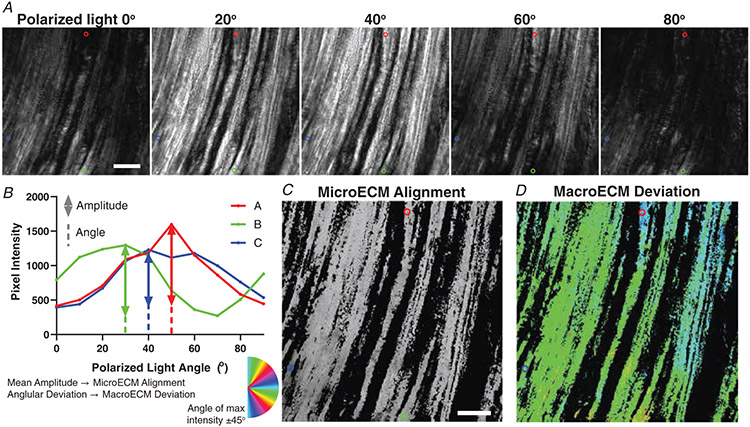
Figure 1. Polarized light picrosirius red imaging and analysis of ECM architecture.
A, each muscle was imaged with a polarizer at the given angle and an analyser 90° from the polarizer. Images were taken at every 10° between 0° and 90°. The red, blue, and green circles are highlighting the same three pixels across all angles and analyses. B, example pixel intensities across the range of angles are demonstrated. The amplitude is used to determine the mean pixel microECM alignment. The circular standard deviation of the angle of maximum intensity is used to determine macroECM deviation. C, the image is scaled based on the mean amplitude (microECM alignment) of each pixel. D, the same image is represented by the angle of maximum intensity, with the primary orientation of the ECM being 45° from that angle as represented by the colour. The circular standard deviation across the muscle is used to calculate the macroECM. Pixels below an average intensity threshold were not included in C and D or the analysis. Scale bar = 100 μm.

