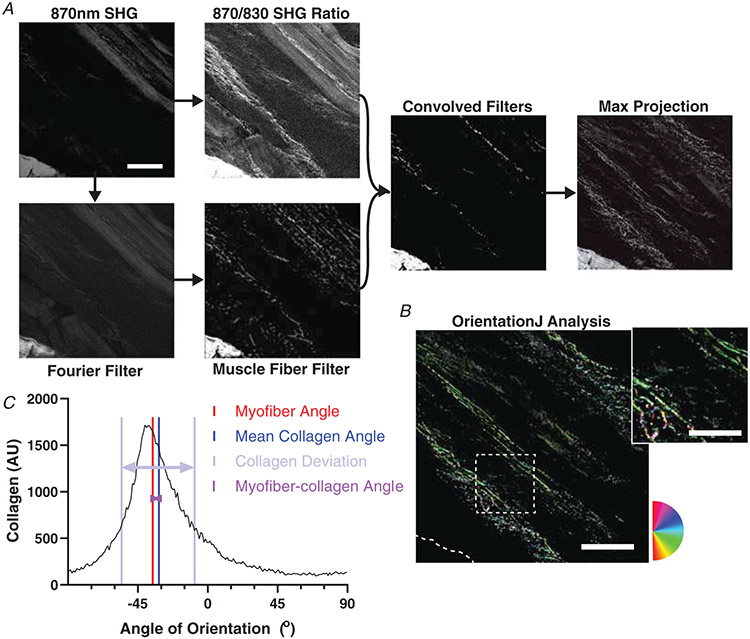
Figure 2. Second harmonic generation (SHG) image processing and analysis.
A, flowchart of the SHG image processing code run in MATLAB. Representative images of each stage of processing shown. SHG Original Image was the raw image taken from the SHG microscope. SHG 870/830 Ratio was the result of rescaling the original image based on relative pixel intensities at 870 nm and 830 nm wavelengths. Fourier Transform is the result of using a Fourier transform to identify and remove sarcomeres from the SHG original image. Fibre filter is the result of removing fibre structures from the Fourier transform image. Convolved filters is the result of rescaling a combination of the fibre filter and SHG 870/830 Ratio images. Max projection is the result of taking the maximum intensity at each pixel location from the entire stack of convolved filter images, and compressing the stack into a single image (A). B, as for all images, any tendon or aponeurosis was removed manually as in the lower left portion. OrientationJ analysis and distribution was run to measure the frequencies of orientations present in the max projection. The inset shows a portion of the image with collagen fibres visible along with changing colour as orientation shifts according to the circular colour scale. C, the colour survey map is shown representing the histogram with orientation frequencies. The myofibre angle is depicted along with the circular average of the collagen angles. The myofibre–collagen angle is the difference between these two. The collagen deviation is a measure of the spread of the histogram from the mean collagen angle. Scale bar = 100 μm; inset = 50 μm.

