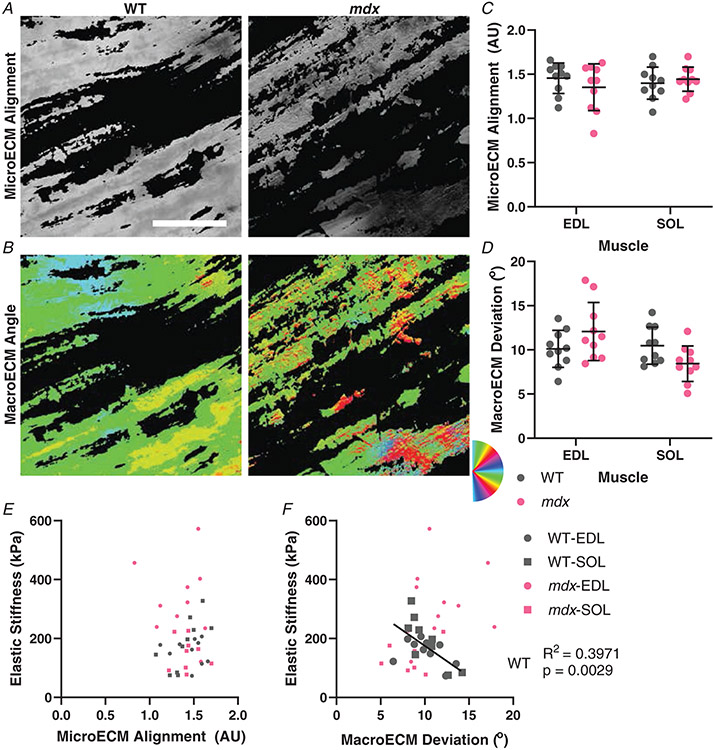
Figure 5. ECM orientation observed using picrosirius red stain and polarized light microscopy.
A, example images from wildtype and mdx EDL muscles that show the microECM alignment. B, the same images depicting macroECM deviation with colours representing the angle of ECM orientation. C, the quantification of the microECM alignment shows no significant difference between genotypes in either muscle. D, the macroECM deviation shows no significant difference between genotypes in either muscle, with all groups having approximately 10° deviation. E, the microECM alignment was not significantly correlated with elastic stiffness overall or for any subgroup. F, the relationship between macroECM deviation and elastic stiffness showed a significant negative correlation in wildtype muscles that was not present in mdx muscles. Scale bar = 100 μm.

