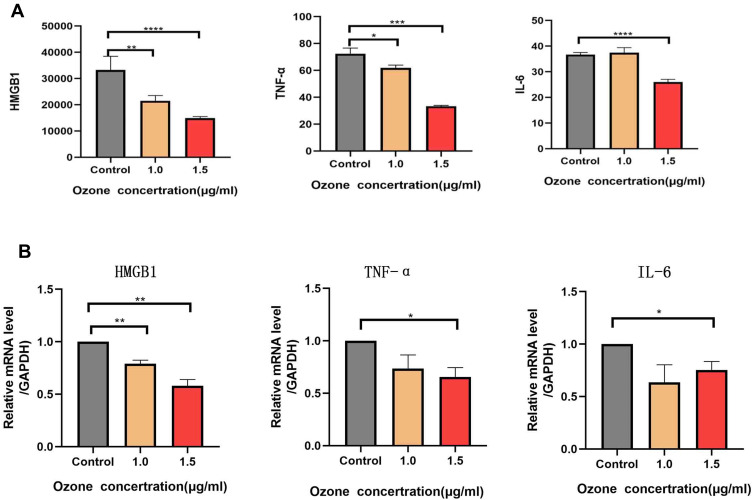
Figure 6.
Cytokines HMGB1, IL-6, and TNF-α were detected using ELISA and their mRNA expression levels were detected using RT-qPCR. (A) The cytokine concentrations of HMGB1 and TNF-α were low in the group of cells treated with 1.0 and 1.5 μg/mL of ozonated water, and the concentration of IL-6 was low in the group of cells treated with 1.5μg/mL of ozonated water. (B) The mRNA expression of HMGB1 was low in the cells treated with 1.0 and 1.5 μg/mL of ozonated water, and the mRNA expression levels of IL-6 and TNF-α were low in the group of cells treated with 1.5 μg/mL *P<0.05, ** P<0.01, *** P<0.001**** P<0.0001, n=3.

