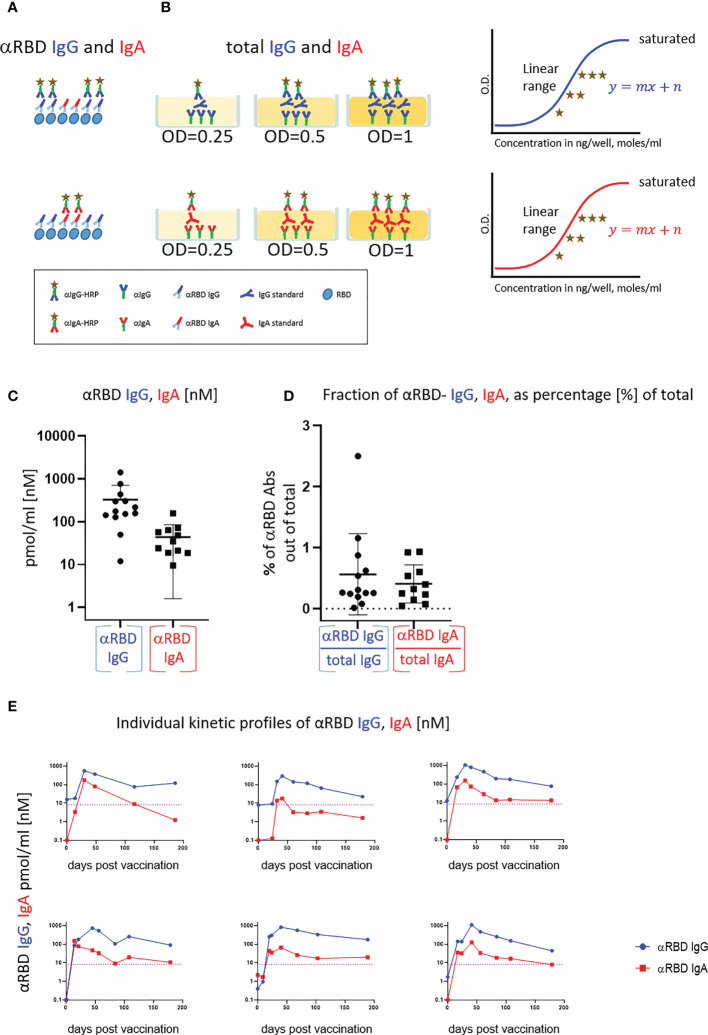
Figure 2.
Quantitative ELISA measurement of anti-RBD IgG and IgA content in biological fluids. (A) Schematic representation of detection of anti-RBD IgG or IgA by indirect ELISA using isotype-specific HRP-conjugated secondary antibodies. OD values are not directly comparable between the isotypes because of the use of different secondary antibodies. (B) Schematic representation of sandwich capturing ELISA for selective quantification of total immunoglobulin isotypes (IgG vs. IgA). Yellow stars schematically represent molar equivalents of antibody quantities. We introduce pure IgA and IgG commercial references to transform the OD values to their molar equivalents, using the standard dilution curve in capture ELISA format. Implementing such a standard in every experiment allows for determining the antigen specific and total molar amounts of each isotype within the linearity range. We assume average molecular weight (MW) of IgG = 146 kDa and IgA = 150 kDa in circulation. (C) Molar measurement of anti-RBD IgG and IgA implementing the methodology described in (A, B) depicts stoichiometric ratios between the antigen-specific isotypes. (D) Percentage of antigen-specific anti-RBD out of total immunoglobulin isotype, as indicated. (E) Individual longitidual profiles of anti-RBD IgG (blue) and IgA (red) monitored in six vaccinated individuals up to 7 months after vaccination are inferred as picomole per ml of serum.

