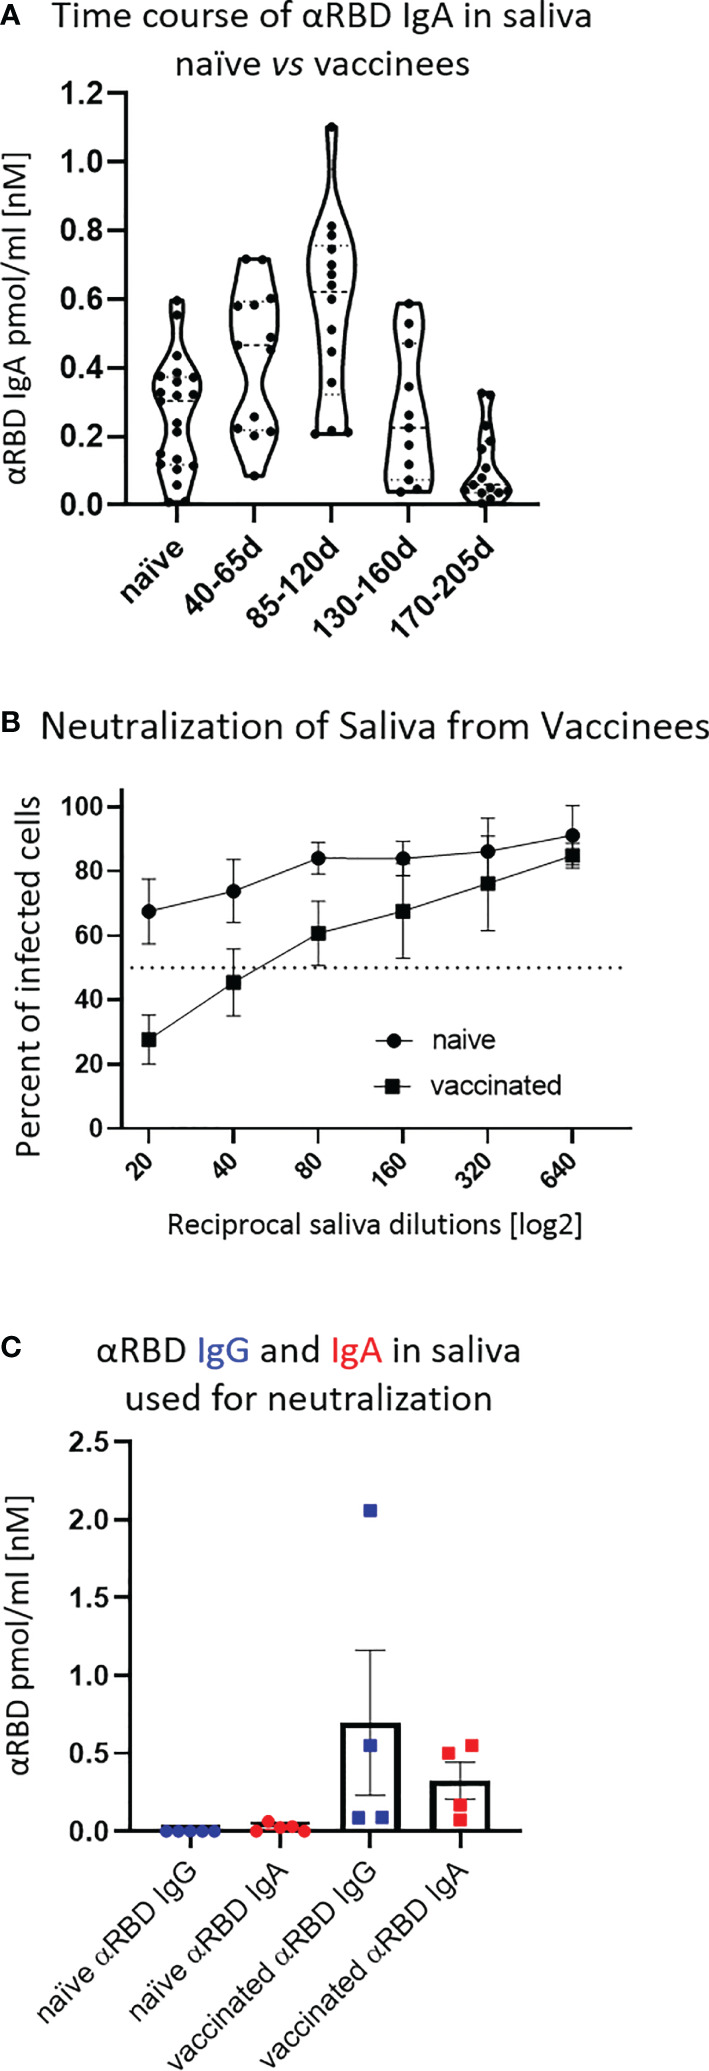
Figure 3.

Detection of anti-RBD IgA in resting saliva of BNT162b2 vaccinees and characterization of its neutralizing potential. (A) Longitudinal assessment of molar quantities of anti-RBD IgA in saliva of vaccinees compared with naïve individuals is presented in picomole per ml and time-categorized as indicated. The molar expression in saliva is corrected to bi-valent for the comparison to circulatory immunoglobulins. (B) Saliva neutralization assessed by SARS-CoV-2 spike-pseudotyped VSV-GFP-ΔG reporter assay on Vero-E6 cells. Neutralization is expressed as a percentage of pseudovirus-infected green cells without incubation with saliva (total infection = 100%). Percentage of independently measured neutralization by five naïve individuals vs. four vaccinees are plotted as a function of the reciprocal values of sera dilutions displayed on a log2 scale, as indicated. Each neutralization curve was tested in three biological replicates. Standard deviation represents difference between individuals in each group. The NT50 of vaccinees saliva is achieved on average at the dilution of ∼1:60, extrapolated by cross-section with the dashed line. The specific neutralization NT50 value is reached at dilution of ∼1:20 and represents “vaccine-added” neutralization, corrected to the basal innate neutralization of naïve individuals, that is probably the consequence of innate proteolytic and mucus (lectin) presence in naïve saliva. (C) The values of anti-RBD IgA and IgG in picomole per ml of five naïve saliva samples and four saliva samples of vaccinees, used in neutralization assay described in (B) are shown.
