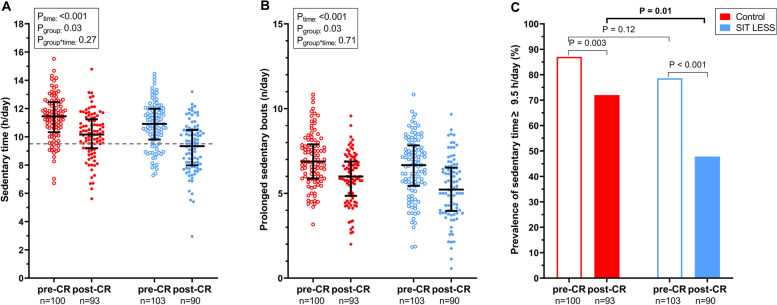
Fig. 3.
Sedentary behaviour outcomes of the SIT LESS randomised clinical trial in patients with coronary artery disease pre- and post-cardiac rehabilitation (CR). Panel A scatter plot of sedentary time with median and interquartile range compared between the control- (in red) and the SIT LESS group (in blue). The dashed line represents the upper-limit of normal daily sedentary time (9.5 h per day). P-values are based on mixed model analysis. Panel B scatter plot with of prolonged sedentary bouts (≥ 30 min per day) with median and interquartile range compared between the control- (in red) and the SIT LESS group (in blue). P-values are based on mixed model analysis. Panel C prevalence of sedentary time above the upper-limit of normal pre- and post-CR, with a significantly lower proportion of patients with a daily sedentary time above the upper-limit after CR in the SIT LESS group (in blue) compared to the control group (in red). The p-value representing the between group difference post-CR (p = 0.01) was adjusted for pre-CR sedentary time

