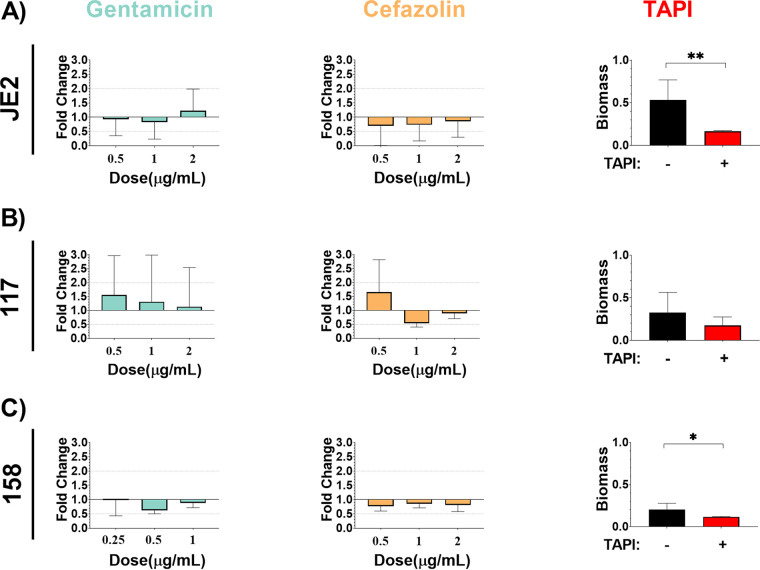
FIG 2.
S. aureus biofilms formed under in vitro conditions display recalcitrance to TAPI antibiotics. JE2 (A), 117 (B), and 158 (C) were allowed to form biofilm and were then exposed to increasing concentration of antibiotics. (A) JE2 biofilm (mean, 0.4406; standard deviation [SD], 0.2192; standard error of the mean [SE], 0.05315) was not significantly affected following exposure to increasing concentrations of gentamicin (0.5 μg/mL: P value, 0.9404; mean, 0.4083; SD, 0.2528; SE, 0.1460; and 1 μg/mL: P value, 0.5360; mean, 0.3653; SD, 0.2630; SE, 0.1518; and 2 μg/mL: P value, 0.5351; mean, 0.5410; SD, 0.3338; SE, 0.1927) or cefazolin (0.5 μg/mL: P value, 0.2314; mean, 0.3073; SD, 0.3052; SE, 0.1526; and 1 μg/mL: P value, 0.2314; mean, 0.3220; SD, 0.2488; SE, 0.1244; and 2 μg/mL: P value, 0.6869; mean, 0.3770; SD, 0.2464; SE, 0.1232). TAPI, however, significantly reduced the amount of biomass formed by JE2 (P value, 0.0018; mean, 0.1637; SD, 0.0140; SE, 0.003932). (B) 117 biofilm (mean, 0.2885; SD, 0.2274; SE, 0.06857) was not significantly affected following exposure to increasing concentrations of gentamicin (0.5 μg/mL: P value, 0.6608; mean, 0.4570; SD, 0.4167; SE, 0.2083; and 1 μg/mL: P value, 0.9714; mean, 0.3860; SD, 0.4954; SE, 0.2477; and 2 μg/mL: P value, 0.8491; mean, 0.3348; SD, 0.4128; SE, 0.2064), cefazolin (0.5 μg/mL: P value, 0.5549; mean, 0.4863; SD, 0.3433; SE, 0.1982; and 1 μg/mL: P value, 0.3429; mean, 0.1593; SD, 0.04207; SE, 0.02104; and 2 μg/mL: P value, 0.7325; mean, 0.2625; SD, 0.05548; SE, 0.02265) or to TAPI (P value, 0.3773; mean, 0.1746; SD, 0.1001; SE, 0.04477). (C) 158 biofilm (mean, 0.2013; SD, 0.07619; SE, 0.02694) was not significantly affected following exposure to increasing concentrations of gentamicin (0.25 μg/mL: P value, 0.6303; mean, 0.2217; SD, 0.1243; SE, 0.07178; and 0.5 μg/mL: P value, 0.4970; mean, 0.1410; SD, 0.02862; SE, 0.01652; and 1 μg/mL: P value, 0.8518; mean, 0.1987; SD, 0.03819; SE, 0.01559) or cefazolin (0.5 μg/mL: P value, 0.7758; mean, 0.1733; SD, 0.03911; SE, 0.02258; and 1 μg/mL: P value, 0.9507; mean, 0.1922; SD, 0.03274; SE, 0.01337; and 2 μg/mL: P value, 0.9433; mean, 0.1814; SD, 0.05110; SE, 0.02285). However, TAPI significantly reduced the amount of biomass formed by 158 (P value, 0.0485; mean, 0.1170; SD, 0.004761; SD, 0.002380). The Mann-Whitney U test was used to determine statistical significance, where ** indicates P < 0.01, and *** indicates P < 0.0005. P > 0.05 indicates no significant difference. Bar graphs include the means and SDs.

