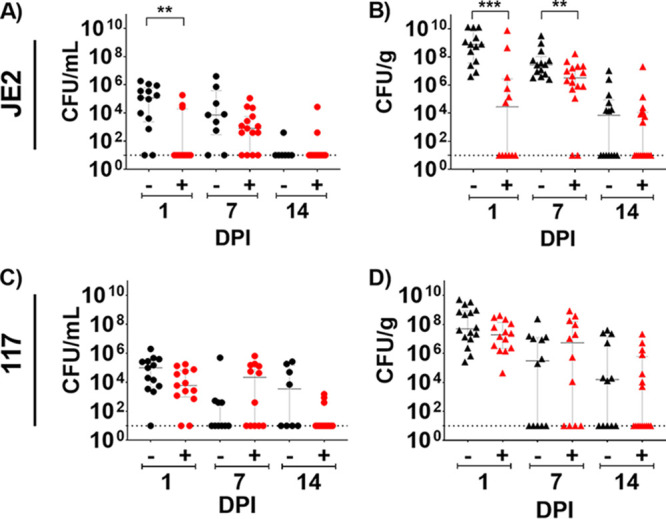
FIG 4.

Mouse model of S. aureus breast implant-associated infection (BIAI). (A) Implants recovered from saline-treated mice displayed high colony forming units (CFU) of JE2 at 1 day postinfection (dpi) (mean, 3.8 × 10⁵; SD, 5.65 × 10⁵; SE, 1.57 × 10⁵), which persisted at 7 dpi (mean, 5.32 × 10⁵; SD, 1.32 × 10⁶; SE, 4.41 × 10⁵). However, mice were able to control JE2 infection by 14 dpi (mean, 6.57 × 101; SD, 1.47 × 10²; SE, 5.57 × 101). Triple antibiotic pocket irrigant (TAPI) significantly reduced JE2 CFU on implants compared to the saline-treated control mice at 1 dpi (P value, 0.0030; mean, 2.05 × 10⁴; SD, 5.29 × 10⁴; SE, 1.53 × 10⁴). However, by 7 dpi (P value, 0.2049; mean, 1.17 × 10⁴; SD, 2.91 × 10⁴; SE, 7.51 × 10³), there was no difference in CFU recovered from TAPI or saline-treated mice. At 14 dpi (P value, >0.9999; mean, 1.82 × 10³; SD, 6.89 × 10³; SE, 1.78 × 10³), most mice cleared JE2 regardless of treatment. (B) Tissue from saline-treated mice displayed high CFU of JE2 at 1 and 7 dpi (mean, 3.43 × 10⁹; SD, 5.44 × 10⁹; SE, 1.51 × 10⁹; and mean, 3.32 × 10⁸; SD, 8.63 × 10⁸; SE, 2.31 × 10⁸, respectively). However, half the mice were able to control the infection by 14 dpi (mean, 9.50 × 10⁵; SD, 2.83 × 10⁶; SE, 7.56 × 10⁵). TAPI significantly reduced CFU in the tissue compared to the saline-treated mice at 1 and 7 dpi (P value, 0.0002; mean, 6.72 × 10⁸; SD, 2.19 × 10⁹; SE, 6.32 × 10⁸; and P value, 0.0089; mean, 1.86 × 10⁷; SD, 4.10 × 10⁷; SE, 1.03 × 10⁷, respectively). Again, about half the mice cleared the infection with JE2 regardless of treatment by 14 dpi (P value, 0.4409; mean, 1.27 × 10⁶; SD, 5.05 × 10⁸; SE, 1.26 × 10⁶). (C) Implants recovered from saline-treated mice displayed high CFU of 117 at 1 dpi (mean, 2.84 × 10⁵; SD, 5.40 × 10⁵; SE, 1.50 × 10⁵), which persisted at both 7 and 14 dpi (mean, 4.97 × 10⁴; SD, 1.57 × 10⁵; SE, 4.96 × 10⁴; and mean, 6.31 × 10⁴, SD, 1.03 × 10⁵; SE, 3.64 × 10⁴, respectively). There was no significant difference in CFU recovered from implants of TAPI-treated mice at 1 dpi (P value, 0.0640; mean, 3.87 × 10⁴; SD, 5.81 × 10⁴; SE, 1.61 × 10⁴), 7 dpi (P value, 0.2481; mean, 1.01 × 10⁵; SD, 1.85 × 10⁵; SE, 5.34 × 10⁴), and 14 dpi (P value, 0.0557; mean, 1.95 × 10²; SD, 4.37 × 10²; SE, 1.13 × 10²) compared to saline-treated mice. (D) Tissue from saline-treated mice displayed high CFU of 117 at 1 dpi (mean, 8.35 × 10⁷; SD, 1.28 × 10⁸; SE, 3.43 × 10⁷), which persisted at both 7 and 14 dpi (mean, 1.25 × 10⁸; SD, 2.49 × 10⁸; SE, 7.18 × 10⁷; and mean, 1.80 × 10⁶; SD, 5.31 × 10⁶; SE, 1.33 × 10⁶, respectively). There was no difference in CFU recovered from tissues of TAPI-treated mice at 1 dpi (P value, 0.1417; mean, 8.35 × 10⁷; SD, 1.28 × 10⁸; SE, 3.43 × 10⁷), 7 dpi (P value, 0.3638; mean, 1.25 × 10⁸; SD, 2.49 × 10⁸; SE, 7.18 × 10⁷), and 14 dpi (P value, 0.2980; mean, 1.80 × 10⁶; SD, 5.31 × 10⁷; SE, 1.33 × 10⁷) compared to saline-treated mice. Red represents TAPI-treated mice, while black denotes saline-treated mice. Each circle represents the CFU recovered from an implant of each mouse. Each triangle denotes the CFU retrieved from tissue near the implant of each mouse. The Mann-Whitney U test was used to determine statistical significance, where ** indicates P < 0.01, and *** indicates P < 0.0005. P > 0.05 indicates no significant differences. Bar graphs represent the median and the interquartile range.
