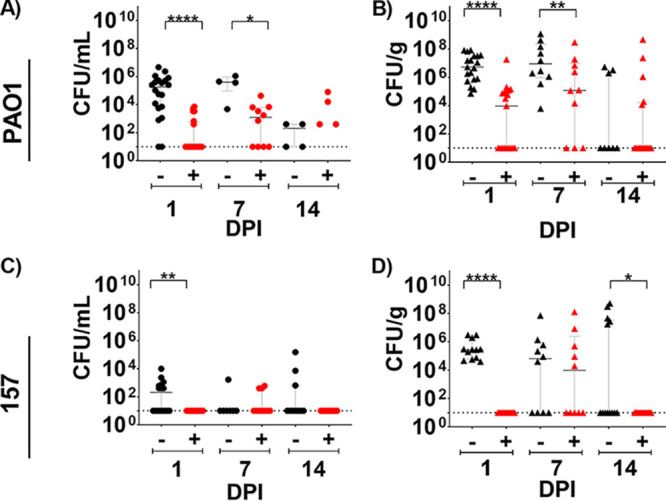
FIG 7.

P. aeruginosa mouse breast implant-associated infection (BIAI) model. (A) Implants recovered from saline-treated, control mice displayed high colony forming units (CFU) of PAO1 at 1 day postinfection (dpi) (mean 5.69 × 10⁵; SD 1.11 × 10⁶; SE 2.47 × 10⁵), which persisted at 7 dpi (mean, 4.78 × 10⁵; SD, 4.56 × 10⁵; SE, 2.28 × 10⁵). However, mice were able to eliminate PAO1 by 14 dpi (mean, 2.05 × 10²; SD, 2.25 × 10²; SE, 1.13 × 10²). TAPI significantly reduced CFU on implants compared to control mice at 1 and 7 dpi (P value, <0.0001; mean, 1.03 × 10³; SD, 2.09 × 10³; SE, 4.67 × 10²; and P value, 0.0120; mean, 6.16 × 10³; SD, 1.30 × 10⁴; SE, 4.11 × 10³, respectively). At 14 dpi, most mice eliminated PAO1 regardless of treatment (P value, 0.1504; mean, 7.45 × 10³; SD, 2.22 × 10⁴; SE, 6.17 × 10³). (B) Tissue from control mice displayed high CFU of PAO1 at 1 dpi (mean, 2.05 × 10⁷; SD, 2.79 × 10⁷; SE, 6.39 × 10⁵), which persisted at 7 dpi (mean, 1.79 × 10⁸; SD, 3.68 × 10⁸; SE, 1.16 × 10⁸). At 14 dpi, most mice eliminated PAO1 from the tissue (mean, 1.32 × 10⁶; SD, 2.03 × 10⁶; SE, 7.18 × 10⁵). TAPI significantly reduced PAO1 CFU in the tissue compared to control mice at 1 dpi (P value, <0.0001; mean, 1.00 × 10⁶; SD, 4.17 × 10⁶; SE, 9.56 × 10⁵). However, at 7 dpi, similar CFU were recovered from the tissue of TAPI-treated compared to control mice (P value, 0.0748; mean, 3.19 × 10⁷; SD, 9.12 × 10⁷; SE, 2.88 × 10⁷). At 14 dpi, most TAPI-treated mice eliminated PAO1 from the tissue, which was similar to control mice (P value, 0.7327; mean, 3.03 × 10⁷; SD, 1.15 × 10⁸; SE, 2.87 × 10⁷). (C) CFU of BIAI strain 157 could be detected on implants recovered from control mice at 1 dpi (mean, 1.00 × 10³; SD, 2.48 × 10³; SE, 6.19 × 10²). However, at 7 and 14 dpi, most control mice eliminated 157 from the implants (mean, 2.49 × 10²; SD, 6.31 × 10²; SE, 2.39 × 10²; and mean, 1.45 × 10⁴; SD, 4.56 × 10⁴; SE, 1.38 × 10⁴, respectively). TAPI significantly reduced the 157 CFU compared to control mice, as no bacteria were recovered from implants of TAPI-treated mice at 1 and 14 dpi (P value, 0.0057; mean, 10; SD, 0; SE, 0; and P value, 0.0159; mean, 10; SD, 0; SE, 0, respectively), while only a few TAPI-treated mice had detectable CFU on implants at 7 dpi (P value, 0.6691; mean, 1.47 × 10²; SD, 2.27 × 10²l SE, 7.19 × 101). (D) Tissue from control mice displayed high CFU of BIAI strain 157 at 1 and 7 dpi (mean, 8.12 × 10⁵; SD, 1.19 × 10⁶; SE, 3.42 × 10⁵ and mean, 7.39 × 10⁶; SD, 2.26 × 10⁷; SE, 7.14 × 10⁶, respectively). However, more than half of the control mice had no detectable 157 CFU at 14 dpi (mean, 6.82 × 10⁷; SD, 1.54 × 10⁸; SE, 4.12 × 10⁷). TAPI significantly reduced CFU in the tissue compared to the control mice at 1 and 14 dpi (P value, <0.0001; mean, 1.00E1; SD 0; SE 0; and P value, 0.0159; mean, 1.00E1; SD, 0; SE, 0, respectively). While there was no difference in CFU between TAPI and control mice at 7 dpi, few mice had detectable CFU of 157 in the tissue (P value, 0.7863; mean, 1.39 × 10⁷; SD, 4.09 × 10⁷, SE, 1.29 × 10⁷). Red represents TAPI-treated mice, while black denotes control mice. Each circle represents the CFU recovered from an implant of each mouse. Each triangle denotes the CFU retrieved from tissue near the implant of each mouse. The Mann-Whitney U test was used to determine statistical significance, where ** indicates P < 0.01, and *** indicates P < 0.0005. P > 0.05 indicates no significant difference. Graphs represent the median and the interquartile range.
