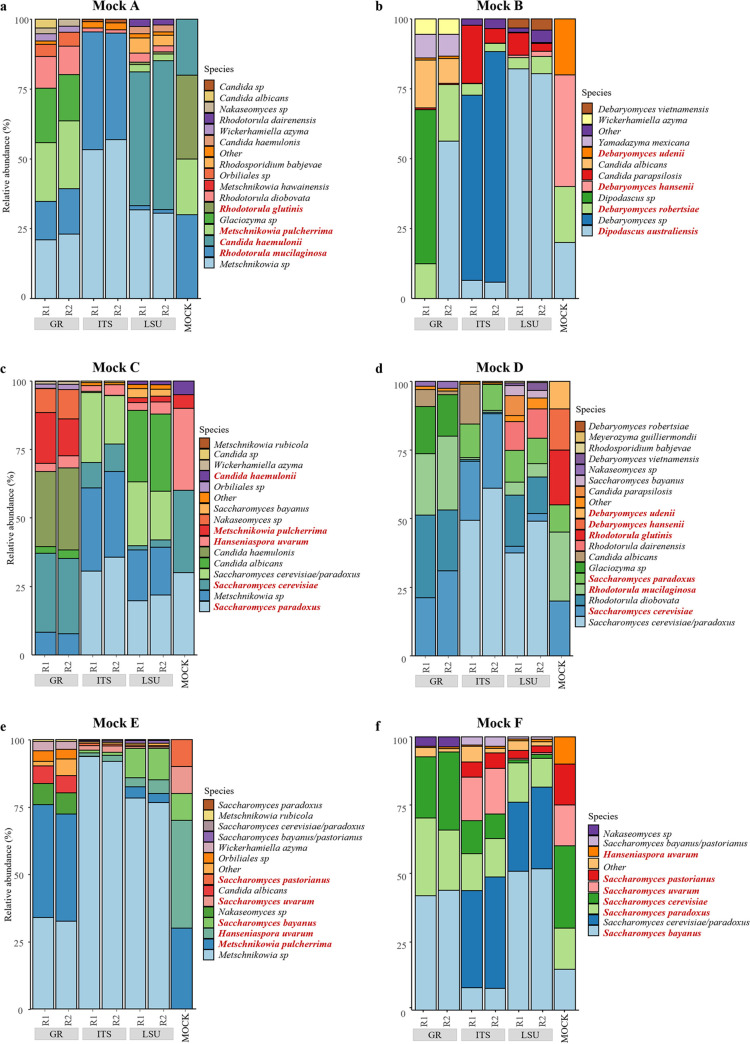
FIG 1.
Fungal diversity of mock communities considering full databases (GR). Each panel shows the abundance (y axis) of species found within a mock community, obtained considering three different databases (x axis) using MinIon sequences. GR is the database composed of ITS sequences taken from UNITE, while ITS and LSU comprise sequences from CBS database. For each reference database, there are two columns that represent the two biological replicates (labeled R1 and R2). The right-most column of each panel represents the supposed abundance. Species present in the mock community are written in red, while the species in black are those identified by the mapping without being added initially. Mock community A contains 30% R. glutinis, 30% R. mucilaginosa, 20% C. haemulonii, and 20% M. pulcherrima. Mock community B contains 40% D. hansenii, 20% D. robertsiae, 20% D. udenii, and 20% D. australiensis. Mock community C contains 30% H. uvarum, 30% S. cerevisiae, 30% S. paradoxus, 5% C. haemulonii, and 5% M. pulcherrima. Mock community D contains 25% R. mucilaginosa, 20% R. glutinis, 20% S. cerevisiae, 10% S. paradoxus, 15% D. hansenii, and 10% D. udenii. Mock community E contains 40% H. uvarum, 30% M. pulcherrima, 10% S. bayanus, 10% S. pastorianus, and 10% S. uvarum. Mock community F contains 30% S. cerevisiae, 15% S. bayanus, 15% S. pastorianus, 15% S. uvarum, 15% S. paradoxus, and 10% H. uvarum.

