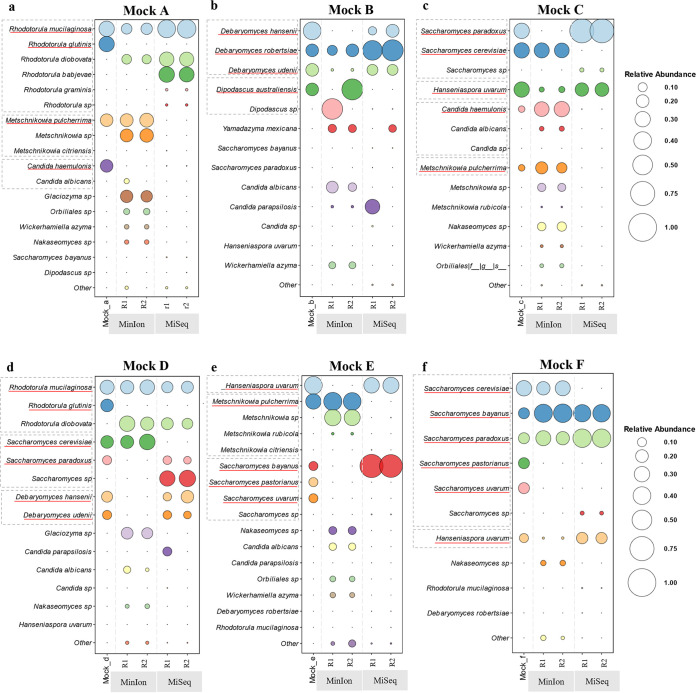
FIG 3.
Comparison of fungal diversity of mock communities at the species level obtained with MinION and Illumina MiSeq, considering the full reference databases (ITS). Each panel shows the abundance of species found within a mock community, expressed with circles of different magnitudes that increase proportionally with the increase of relative abundance from 0 to 1. The database used for the mapping is composed only of ITS sequences in order to compare the two different sequencing methods. For each mock community, the results are summarized in five columns. The left-most column of each panel represents the supposed abundance present in the mock community, and the following two columns represent the two biological replicates (labeled R1 and R2) obtained by MinION, while the last two are those obtained by MiSeq.

