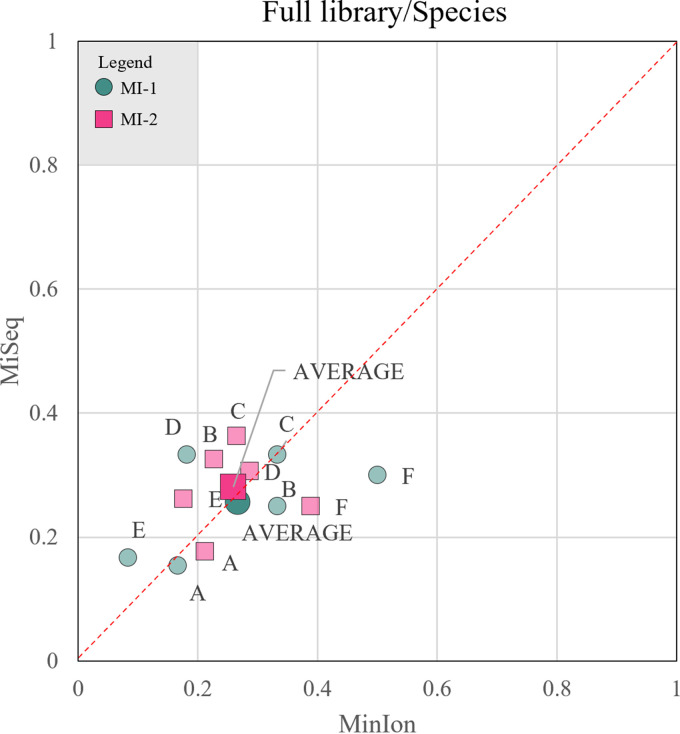
FIG 4.
Comparison of the performance of MinION and MiSeq at the species level by a qualitative and a quantitative approach, considering a full ITS reference database. In order to compare the performance of the two sequencing platforms, two scores were developed to evaluate the matching of estimated and observed values from both a qualitative (MI-1 [pink squares]) and quantitative (MI-2 [dark blue-green circles]) viewpoint. Each mock community (labeled A, B, C, D, E, or F) is characterized by the two scores calculated at the species level for both MinION (x axis) and MiSeq (y axis), considering a full ITS database. The average value for each score, obtained considering all mock communities, is characterized by a bigger marker.

