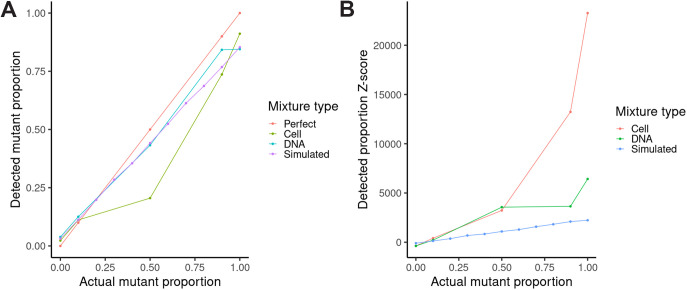
FIG 2.
Evaluating the limit of detection over a range of mutant/parent mixes (cultures, amplicon DNA, and simulated sequence reads). (A) Introduced mutant proportion (x axis) versus detected mutation proportion (y axis) for culture (olive-green), amplicon DNA (blue-green), or simulated (purple) sequence read mixtures along with the diagonal expected if the introduced mutant proportion matched the detected mutation proportion (defined here as a “perfect” correlation; red). (B) Introduced mutant proportion (x axis) versus detected mutation Z-score (y axis) for cell (red), amplicon DNA (green), or simulated (blue) sequence read mixtures.

