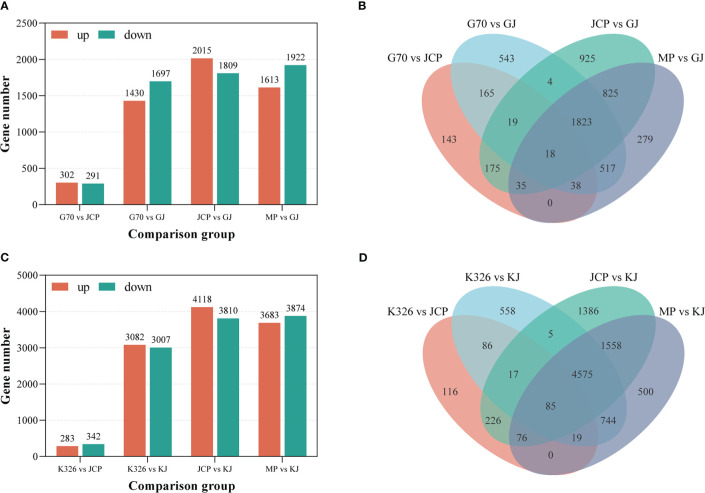
Figure 3.
Distribution of differentially expressed genes (DEGs) between hybrids and parents. MP represents the average value of parents. (A) The number of different expressed genes between GJ and its parents during root development. (B) Venn shows the distribution of GJ and parental DEGs. (C) The number of different expressed genes between KJ and its parents during root development. (D) Venn shows the distribution of KJ and parental DEGs.

