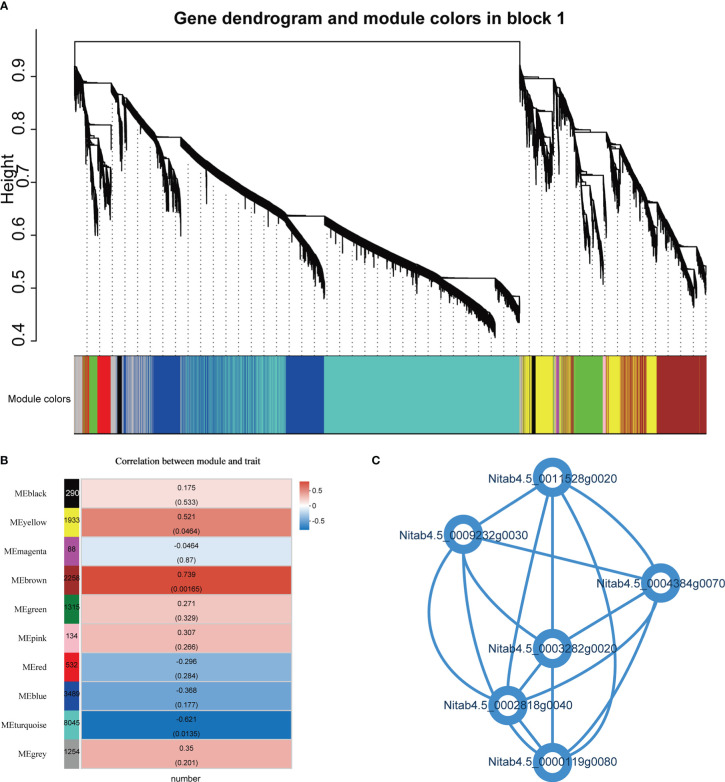
Figure 8.
Weighted gene co-expression network analysis (WGCNA). (A) Hierarchical cluster tree shows 10 modules of co-expressed genes. The lower heatmap shows modules in designated colors. The module grey is for unassigned genes. (B) Heat maps showing the correlation of module-trait, the Pearson correlation coefficient and P values of significant modules are given. (C) Connectivity between 6 genes.

