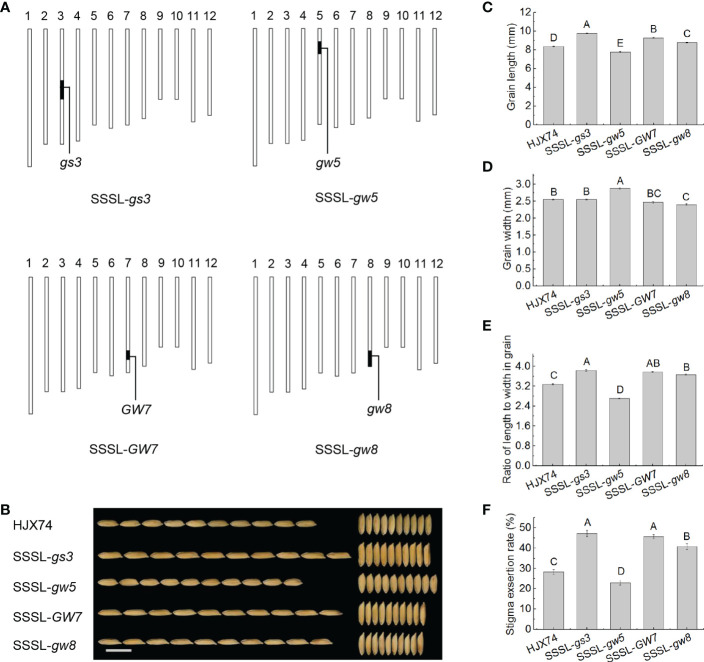
Figure 3.
Grain shape and SER in the SSSLs carrying a gene for grain shape. (A), Graphical genotypes of the SSSLs. The vertical bars are a graphical representation of chromosomes. The black bars represent substitution segments containing target genes for grain shape, and the white regions represent the HJX74 genetic background. (B), Appearance of the grains in HJX74 and SSSLs. Scale bar, 1 cm. Grain length (C), grain width (D), grain RLW (E), and SER (F) in HJX74 and SSSLs. Data are shown as mean ± S.E. of two cropping seasons. Capital letters indicate significant differences at the 0.01 level. SSSL, single-segment substitution line. SER, stigma exsertion rate. RLW, ratio of length to width.

