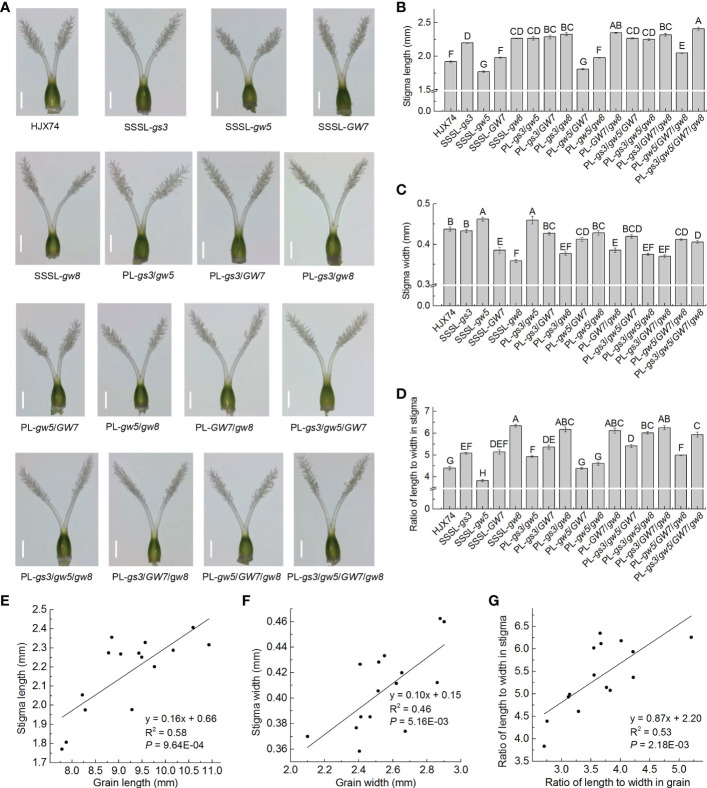
Figure 6.
Stigma shape and its correlations with grain shape. (A), Stigma shape of the SSSLs and PLs. Scale bar, 0.5 mm. (B-D), Stigma length (B), stigma width (C), and stigma RLW (D) in the SSSLs and PLs. Data are shown as mean ± S.E. of two cropping seasons. Capital letters indicate significant differences at the 0.01 level. (E-G), Correlations between grain length and stigma length (E), between grain width and stigma width (F), and between grain RLW and stigma RLW (G). The average value of each line in two cropping seasons is used to perform correlation analysis. R2 represents the percentage of x contribution to y phenotype variation. SSSL, single-segment substitution line. PL, pyramiding line. RLW, ratio of length to width.

