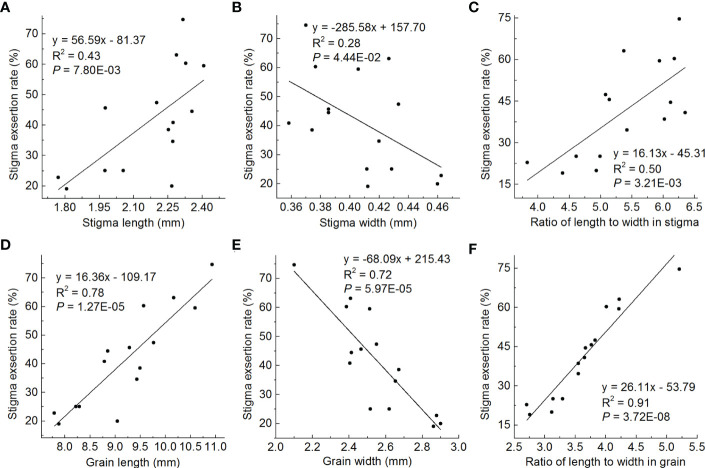
Figure 7.
Regression correlations between stigma shape and SER, and grain shape and SER. (A-C), Correlations between stigma length and SER (A), stigma width and SER (B), and stigma RLW and SER (C). (D-F), Correlations between grain length and SER (D), grain width and SER (E), and grain RLW and SER (F). The average value of each line in two cropping seasons is used to perform statistical analysis. R2 represents the percentage of x contribution to y phenotype variation. SER, stigma exsertion rate. RLW, ratio of length to width.

