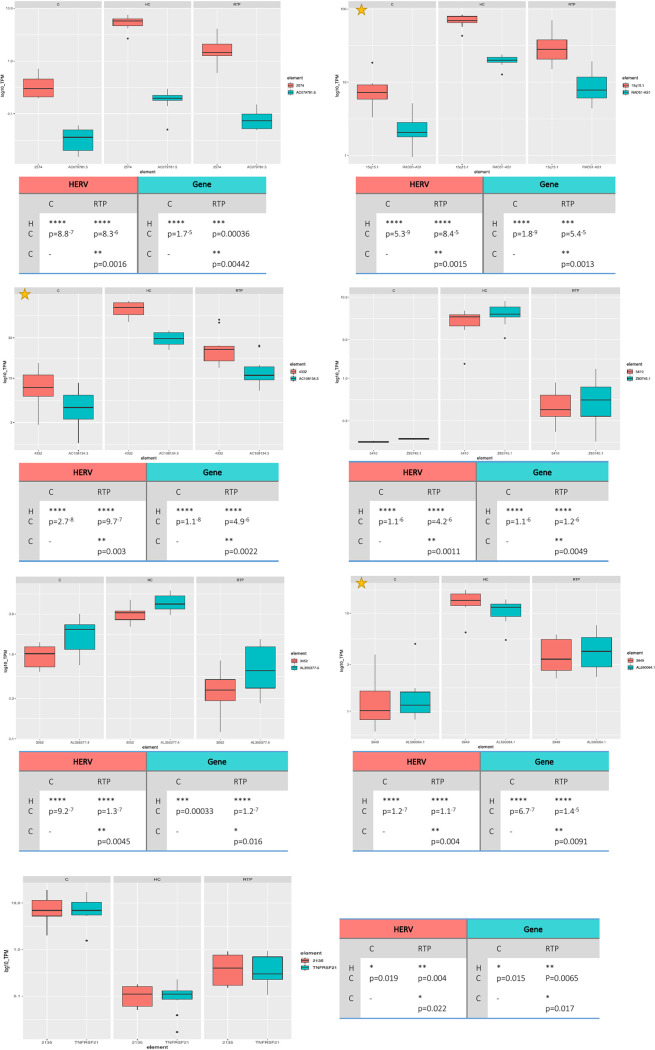
FIG 6.
Boxplot of expression levels for the key deHERVs modulated in all conditions that are colocalized with de-genes. The expression levels (as transcripts per million kilobases values [TPM]) of the 7 out of 31 key deHERVs integrated within cellular genes that were themselves modulated are plotted along with those of the colocalized genes under the different conditions, to assess the possible reciprocal influence. Plots marked with an asterisk are the deHERVs with the highest expression (log10 TPM, >10 for at least one condition). Statistics are based on t test.

