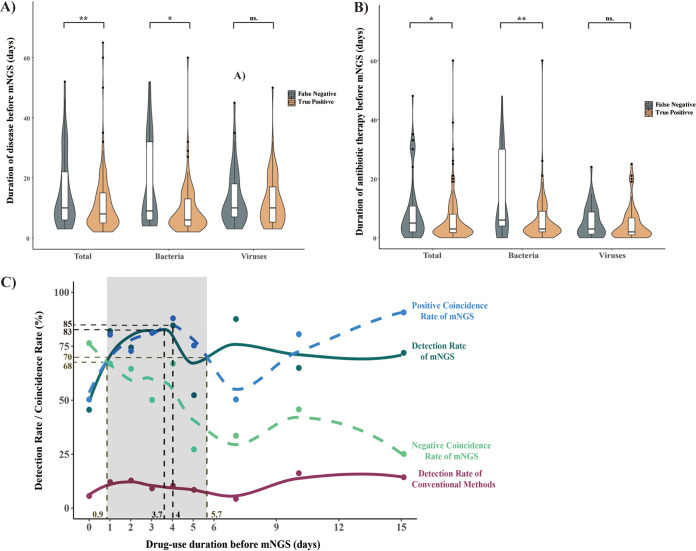
FIG 4.
Relationship between mNGS and clinical risk factors. (A) Correlation between sampling time and cfDNA mNGS results. (B) Correlation between medication time and cfDNA mNGS results. (C) Positive coincidence rate and detection rate of cfDNA mNGS changes with the duration of empirical therapy before mNGS tests. Teal circles represent detection rate of mNGS with empirical therapy for 0, 1, 2, 3, 4 to 5, 6 to 9, or 10 to 15 days. The teal curve represents detection rates of mNGS fit using local polynomial regression fitting. Purple circles and curve represent detection rates of conventional methods. Blue circles and dashed curve represent fit positive coincidence rate of mNGS. Green circles and dashed curve represent fit negative coincidence rate of mNGS.

