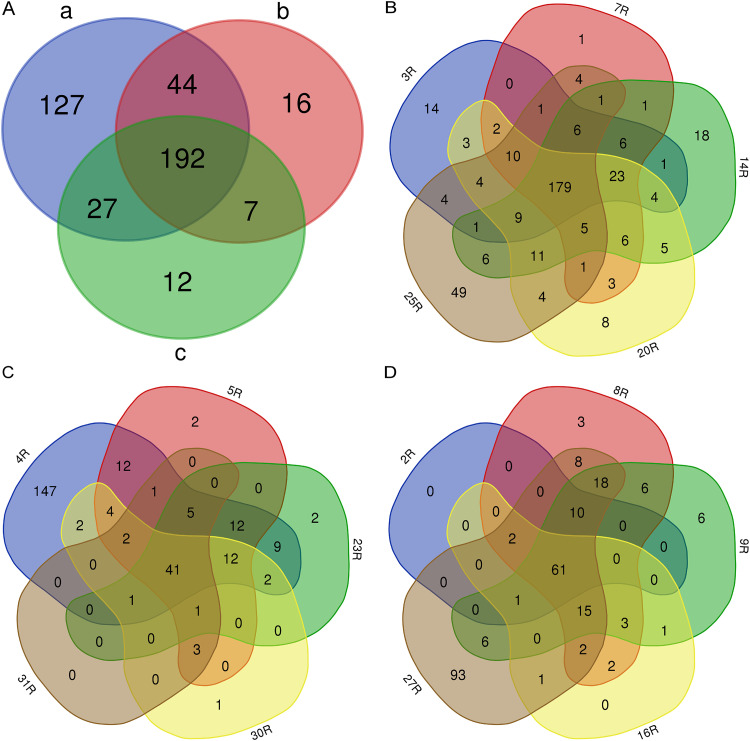
FIG 6.
The comparison of the numbers of extracellular proteins detected in Aa isolates with serotypes a, b, or c. Venn diagrams display the numbers of common and unique identified proteins for isolates with the three different serotypes. The numbers of identified proteins are compared between the three serotypes (A), or for individual isolates of serotype a (B), serotype b (C), or serotype c (D).

