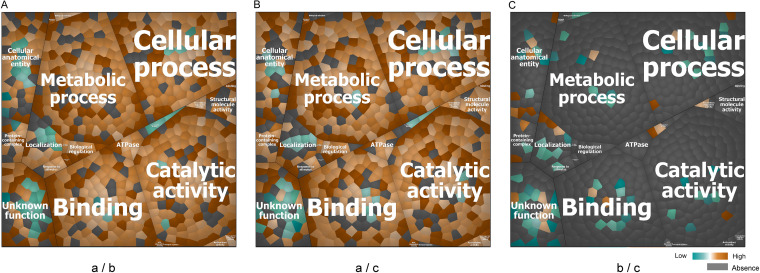
FIG 8.
Functional characterization of the extracellular proteins from all investigated Aa isolates. The functional categories to which identified extracellular proteins belong were first defined by GO terms and then visualized with Voronoi treemaps based on the “second level functions.” To this end, functionally related gene products were assigned to the same cluster and partitioned into weighted polygons with an area proportional to the relative weight of the respective functional category. To highlight the differences between the identified proteins from isolates belonging to pairs of serotypes, only the differential proteins are displayed in the treemaps. (A) Comparison of the relative abundance of extracellular proteins from serotype a and b isolates. (B) Comparison of the relative abundance of extracellular proteins from serotype a and serotype c isolates. (C) Comparison of the relative abundance of extracellular proteins from serotype b and c isolates. Orange marks the proteins with higher abundance in the first-mentioned serotype, while blue marks the proteins with higher abundance in the later serotype (a/b, a/c, or b/c for A, B, and C, respectively). Absent protein ratios are marked in gray.

