
FIG 2.
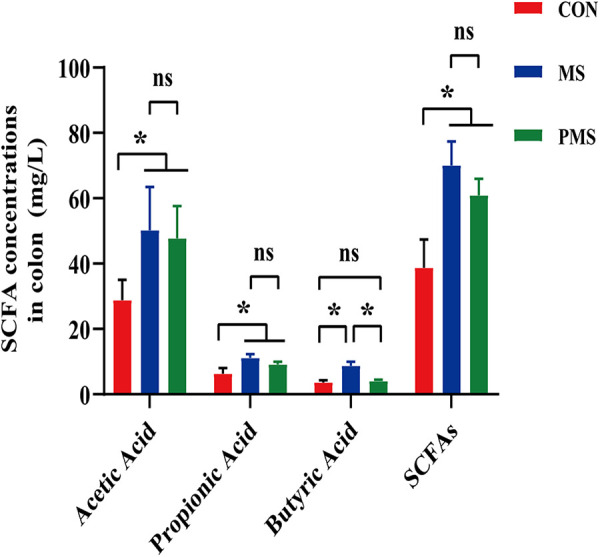
Concentration of short-chain fatty acids in the colon of finishing pigs. CON, control; MS, mulberry silage; PMS, paper mulberry silage. One sample was randomly selected from each replicate in the same treatment (i.e., 4 samples per treatment [n = 4]). The data were evaluated by one-way ANOVA, and the difference between the average values was evaluated by Duncan’s test (*, P < 0.05; **, P < 0.01; ns, nonsignificant difference). The error bars show the SD.