
FIG 3.
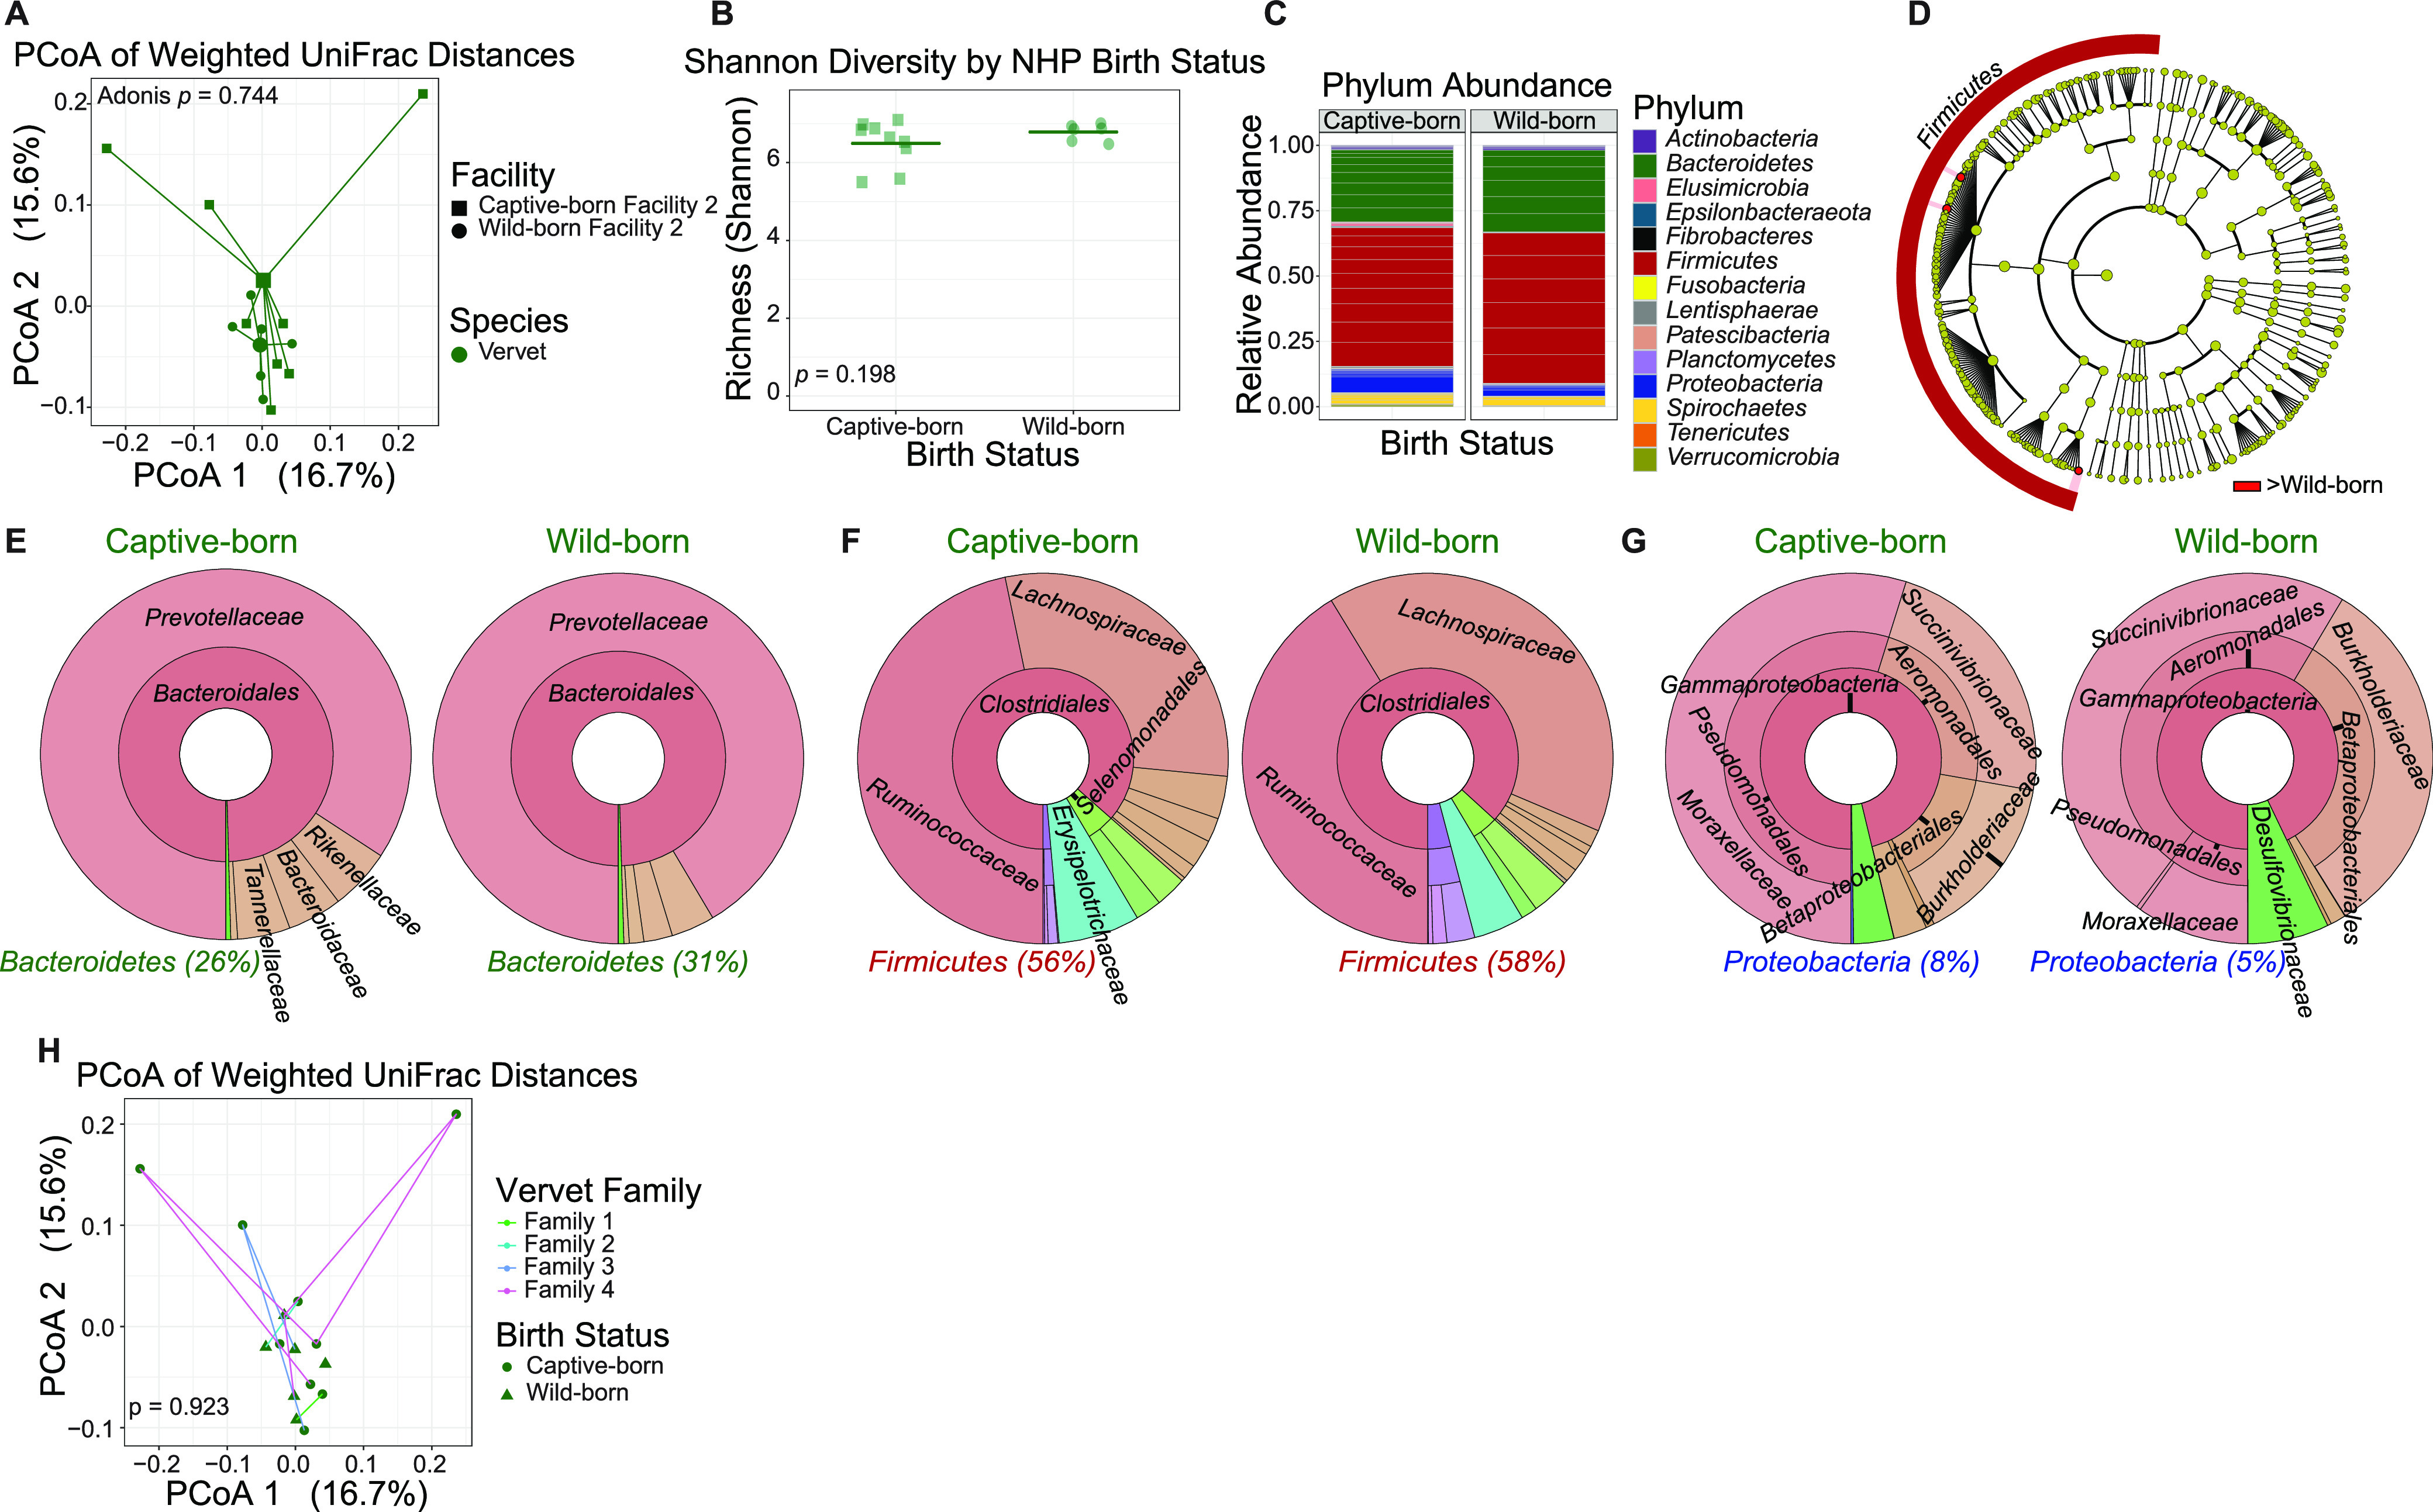
Gut microbiomes by vervet birthplace are not significantly different. (A) Principal-coordinate analysis of weighted UniFrac distances (β diversity) of gut microbiota in vervets born in captivity (n = 9) and vervets born in the wild (n = 6). Significance between vervet groups in fecal β diversity was assessed by Adonis. Lines represent the distance from each sample to the group’s centroid. (B) Shannon diversity (α-diversity) comparison of fecal microbiome between vervet groups. Lines denote means. Significance between groups was determined by unpaired, two-way t test. (C) Relative abundance of bacterial families in vervet groups measured by 16S rRNA gene sequencing. Color is by phylum, and line divisions are by family. (D) LEfSe cladogram representing all taxa in the fecal microbiome down to the genus level, with red nodes (greater in captive-born vervets) indicating significant differences. Gold nodes indicate no significant difference. Labels were restricted to the phylum level for ease of visualization; full results of significant differences down to the genus level are available in Fig. S1, and all OTUs examined are available in Table S1. (E to G) Krona plots representing relative frequency of fecal Bacteroidetes (E), Firmicutes (F), and Proteobacteria (G) subtaxa comprising ≥5% phylum composition to the family level. Shown taxa are collapsed to the lowest common taxon. The percentage given after phyla in panels E to G is the percentage of total bacteria that phylum made up in the group. (H) Principal-coordinate analysis of weighted UniFrac distances of gut microbiota in vervets grouped by those related to one another (family 1, n = 2; family 2, n = 2; family 3, n = 3; family 4, n = 6; 2 vervets were not related to any others in the cohort). Significance between these groups was assessed by Adonis. Lines connect related vervets.