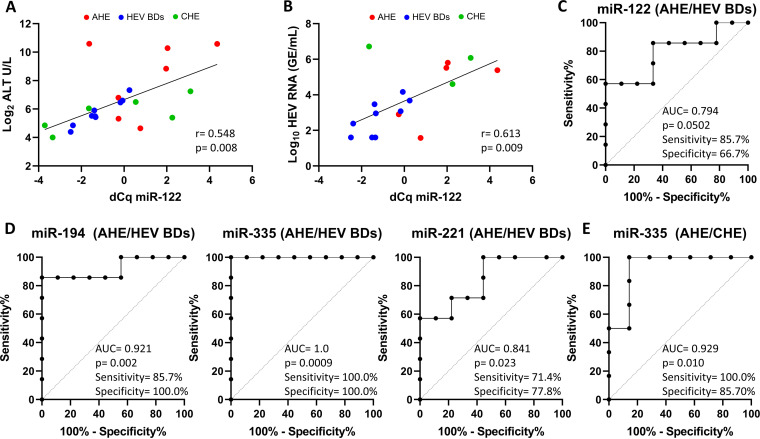
FIG 3.
Predictive performance of circulating microRNA levels in diverse HEV infection outcomes. (A and B) Correlation between miR-122 levels and ALT (A) or viral load (B). GE, genome equivalents. The degree of association between miR-122 and ALT and between miR-122 and viral load was calculated by Spearman rank correlation and Pearson correlation coefficients, respectively. Correlation coefficients (r) and P values are indicated in the graphs. (C and D) ROC plot analysis of predictive discrimination of AHE patients from HEV BDs by miR-122 (C), miR-194 (D, left panel), miR-335 (D, center panel), and miR-221 (D, right panel). (E) ROC plot analysis of predictive discrimination of CHE from AHE patients by miR-335. AUC, P value, and sensitivity and specificity values are indicated. P values of <0.05 were considered significant. Sensitivity and specificity values are given based on the best compromise between these parameters.

