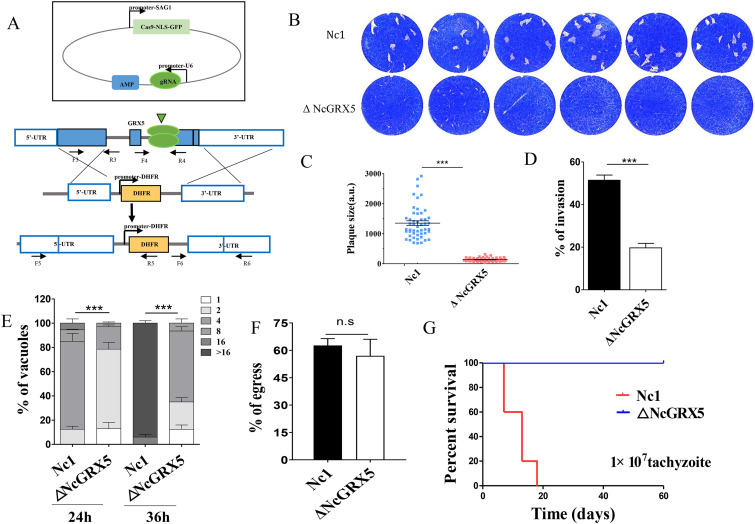
FIG 2.
Reduction in the growth of parasites due to lack of NcGRX5. (A) Strategy for constructing the ΔNcGRX5 strain. (B) Comparing the overall growth ability of wild-type and knockout parasites using plaque assays. Each well was infected with 300 parasites, and plaques were stained for 9 days. (C) Measurements of plaque areas using pixel points in Photoshop C6S software (Adobe, USA). The data were compiled from three independent experiments. Plaque areas were analyzed using one-way ANOVA with Tukey’s post hoc test. Asterisks indicate a significant difference. ***, P < 0.001. (D) Inoculation of HFFs with 1 × 10⁵ parasites and continuous culture for 24 h. The invasion ratio is expressed as the number of vacuoles per host cell. SRS2 was used as a parasite membrane marker, and Hoechst dye was used to count the number of cells. The data are expressed as means ± standard error of the mean (SEM) based on three assays and t test analysis. (E) Inoculation of Nc1 and ΔNcGRX5 tachyzoites (1 × 10⁵) into HFFs and growth for 24 h to evaluate their intracellular replication ability. The data are expressed as the means ± SEM of results obtained from three assays, and in each assay, 100 total PVs of each strain were counted. The data were analyzed by two-way ANOVA. (F) Assessment of parasite egress capacity after treatment with calcium ionophore A23187. The ratio of 100 randomly selected ruptured/integrated vacuoles was determined for each slide. (G) Survival rate of mice after infection with different strains. A total of 1 × 10⁷ tachyzoites were injected intraperitoneally into BALB/c mice (n = 5). Statistical analysis was performed using the LIFETEST procedure in the Statistical Analysis System software (SAS Institute Inc., USA). gRNA, genomic RNA; n.s, no significant difference; UTR, untranslated region.

