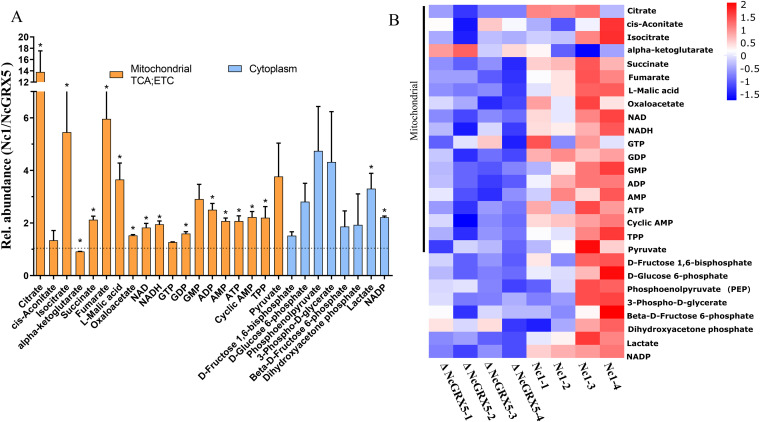
FIG 6.
Influence of NcGRX5 on energy metabolism fluxes. (A) Relative (%) abundance of selected metabolites in Nc1 and ΔNcGRX5 parasites. Bars represent the abundance of metabolites in Nc1 parasites compared to ΔNcGRX5 parasites. Mitochondrial metabolites are indicated by orange columns, and cytoplasmic metabolites are indicated by blue columns. All metabolites were measured by MS-MS, as detailed in Data set 2. (B) Heat map of absolute abundance of metabolites in Nc1 and ΔNcGRX5 parasites. Mean log2 gene expression values are presented. Mitochondrial metabolites are marked on the left side of the heat map. The data are presented as means ± SEM of four independent experiments. *, P < 0.05, t test. ETC, electron transport chain; TPP, thiamin pyrophosphate.

