
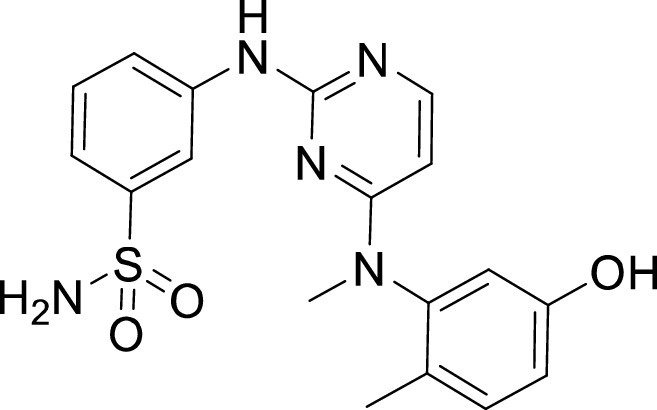
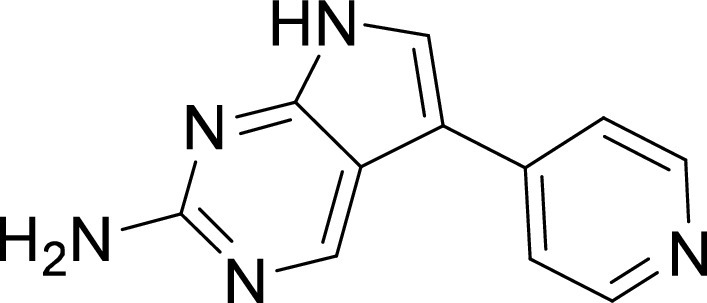
TABLE 1.
Structures and selectivity of 11 hits against C. parvuma
| Compound | Structure | Cp EC50 (μM) | HepG2 CC50 (μM) | Selectivity index |
|---|---|---|---|---|
| 1 |

|
0.04 | >100 | >100 |
| 2 |

|
0.13 | >100 | >100 |
| 3 |

|
0.61 | 33.1 | 54 |
| 4 |
|
0.08 | ND | ND |
| 5 |

|
0.51 | 15.8 | 31 |
| 6 |

|
0.24 | 46.7 | >100 |
| 7 |

|
0.18 | 2.6 | 14 |
| 8 |

|
0.39 | ND | ND |
| 9 |

|
0.31 | ND | ND |
| 10 |

|
0.42 | ND | ND |
| 11 |
|
0.06 | 50.1 | >100 |
a
ND, not determined; due to unavailability of enough compound for the assay. Mean EC50 values based on two independent experiments are shown. Compound structures in SMILES format are provided in Table S3.