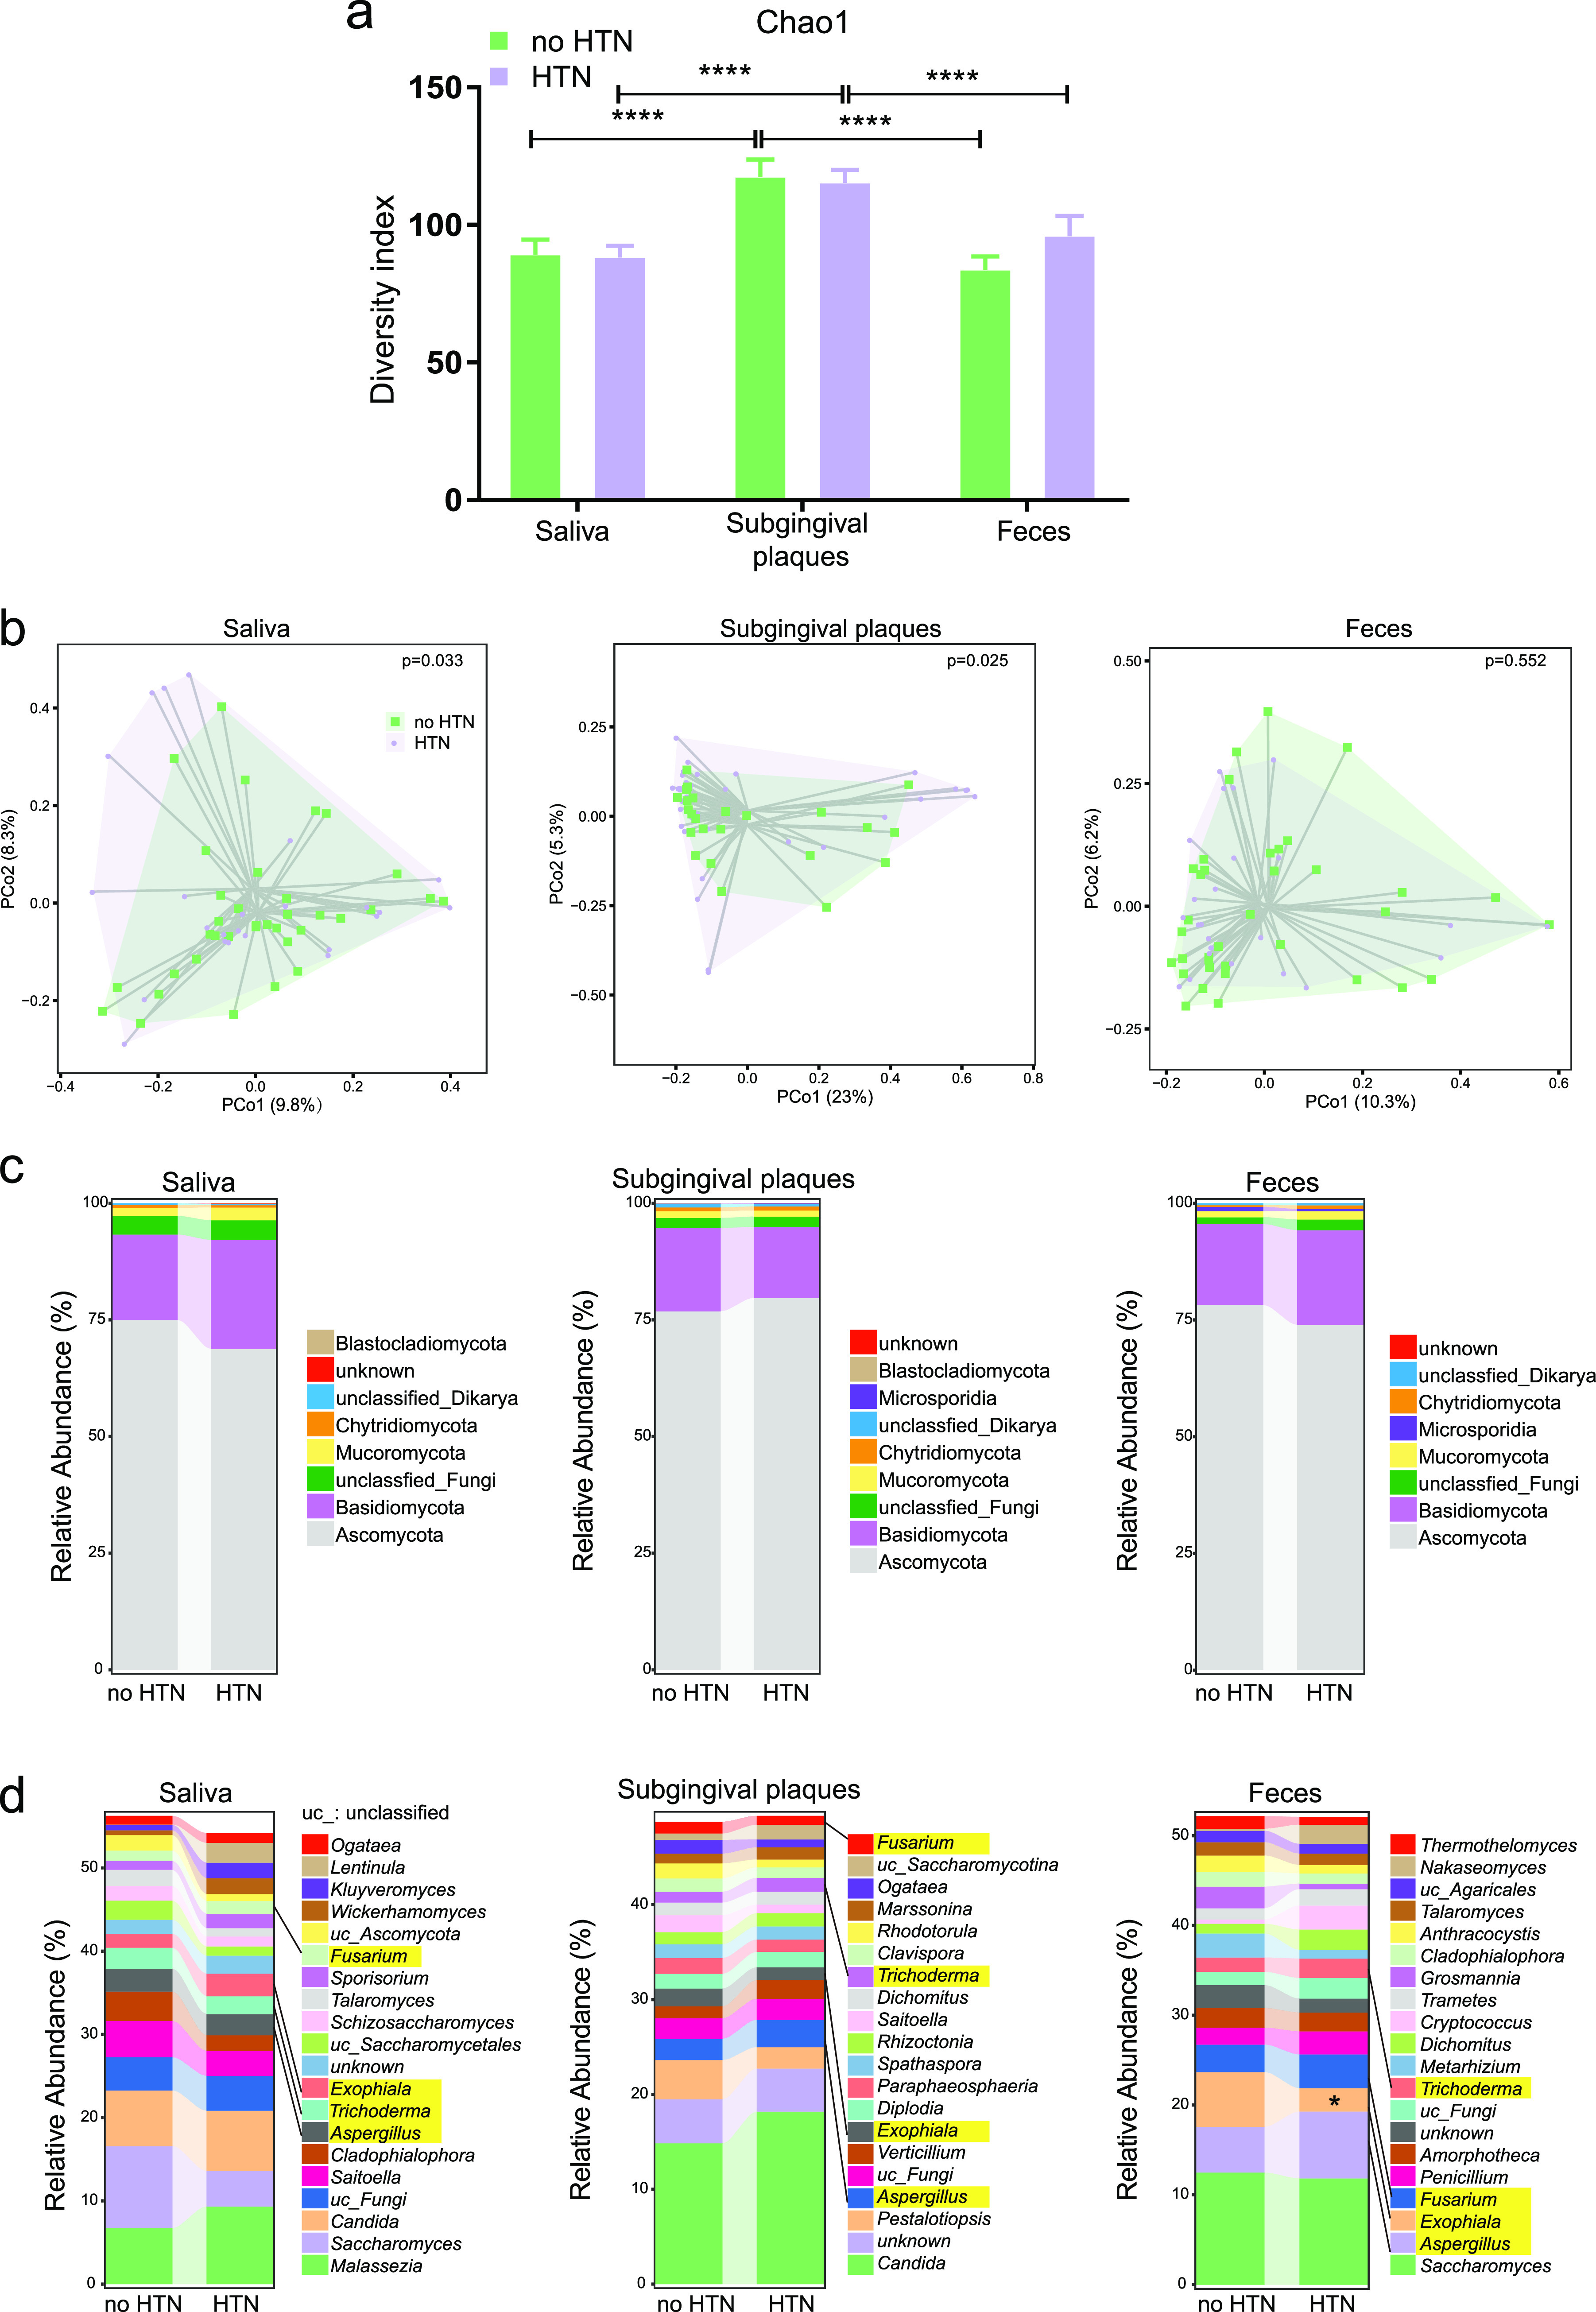
FIG 2.

Comparison of the oral and gut fungal diversity and composition between the no-HTN and HTN groups. (a) Chao1 alpha diversity indices of fungi in saliva, subgingival plaques, and feces of the no-HTN and HTN groups. (b) Beta diversity at the species level assessed by PCoA of Bray-Curtis distance in saliva, subgingival plaques, and feces of the no-HTN and HTN groups. (c and d) Fungal composition in saliva, subgingival plaques, and feces of the no-HTN and HTN groups at the phylum (c) and genus (d) levels. The top 20 genera are depicted in panel d. The four genera shared by all three sample types are highlighted in yellow. Student’s t test was used for statistical analysis in panels a and d, and permutational multivariate analysis of variance was used for panel b. n = 24:36 (no HTN:HTN) for all sample types. *, P < 0.05; ****, P < 0.0001.
