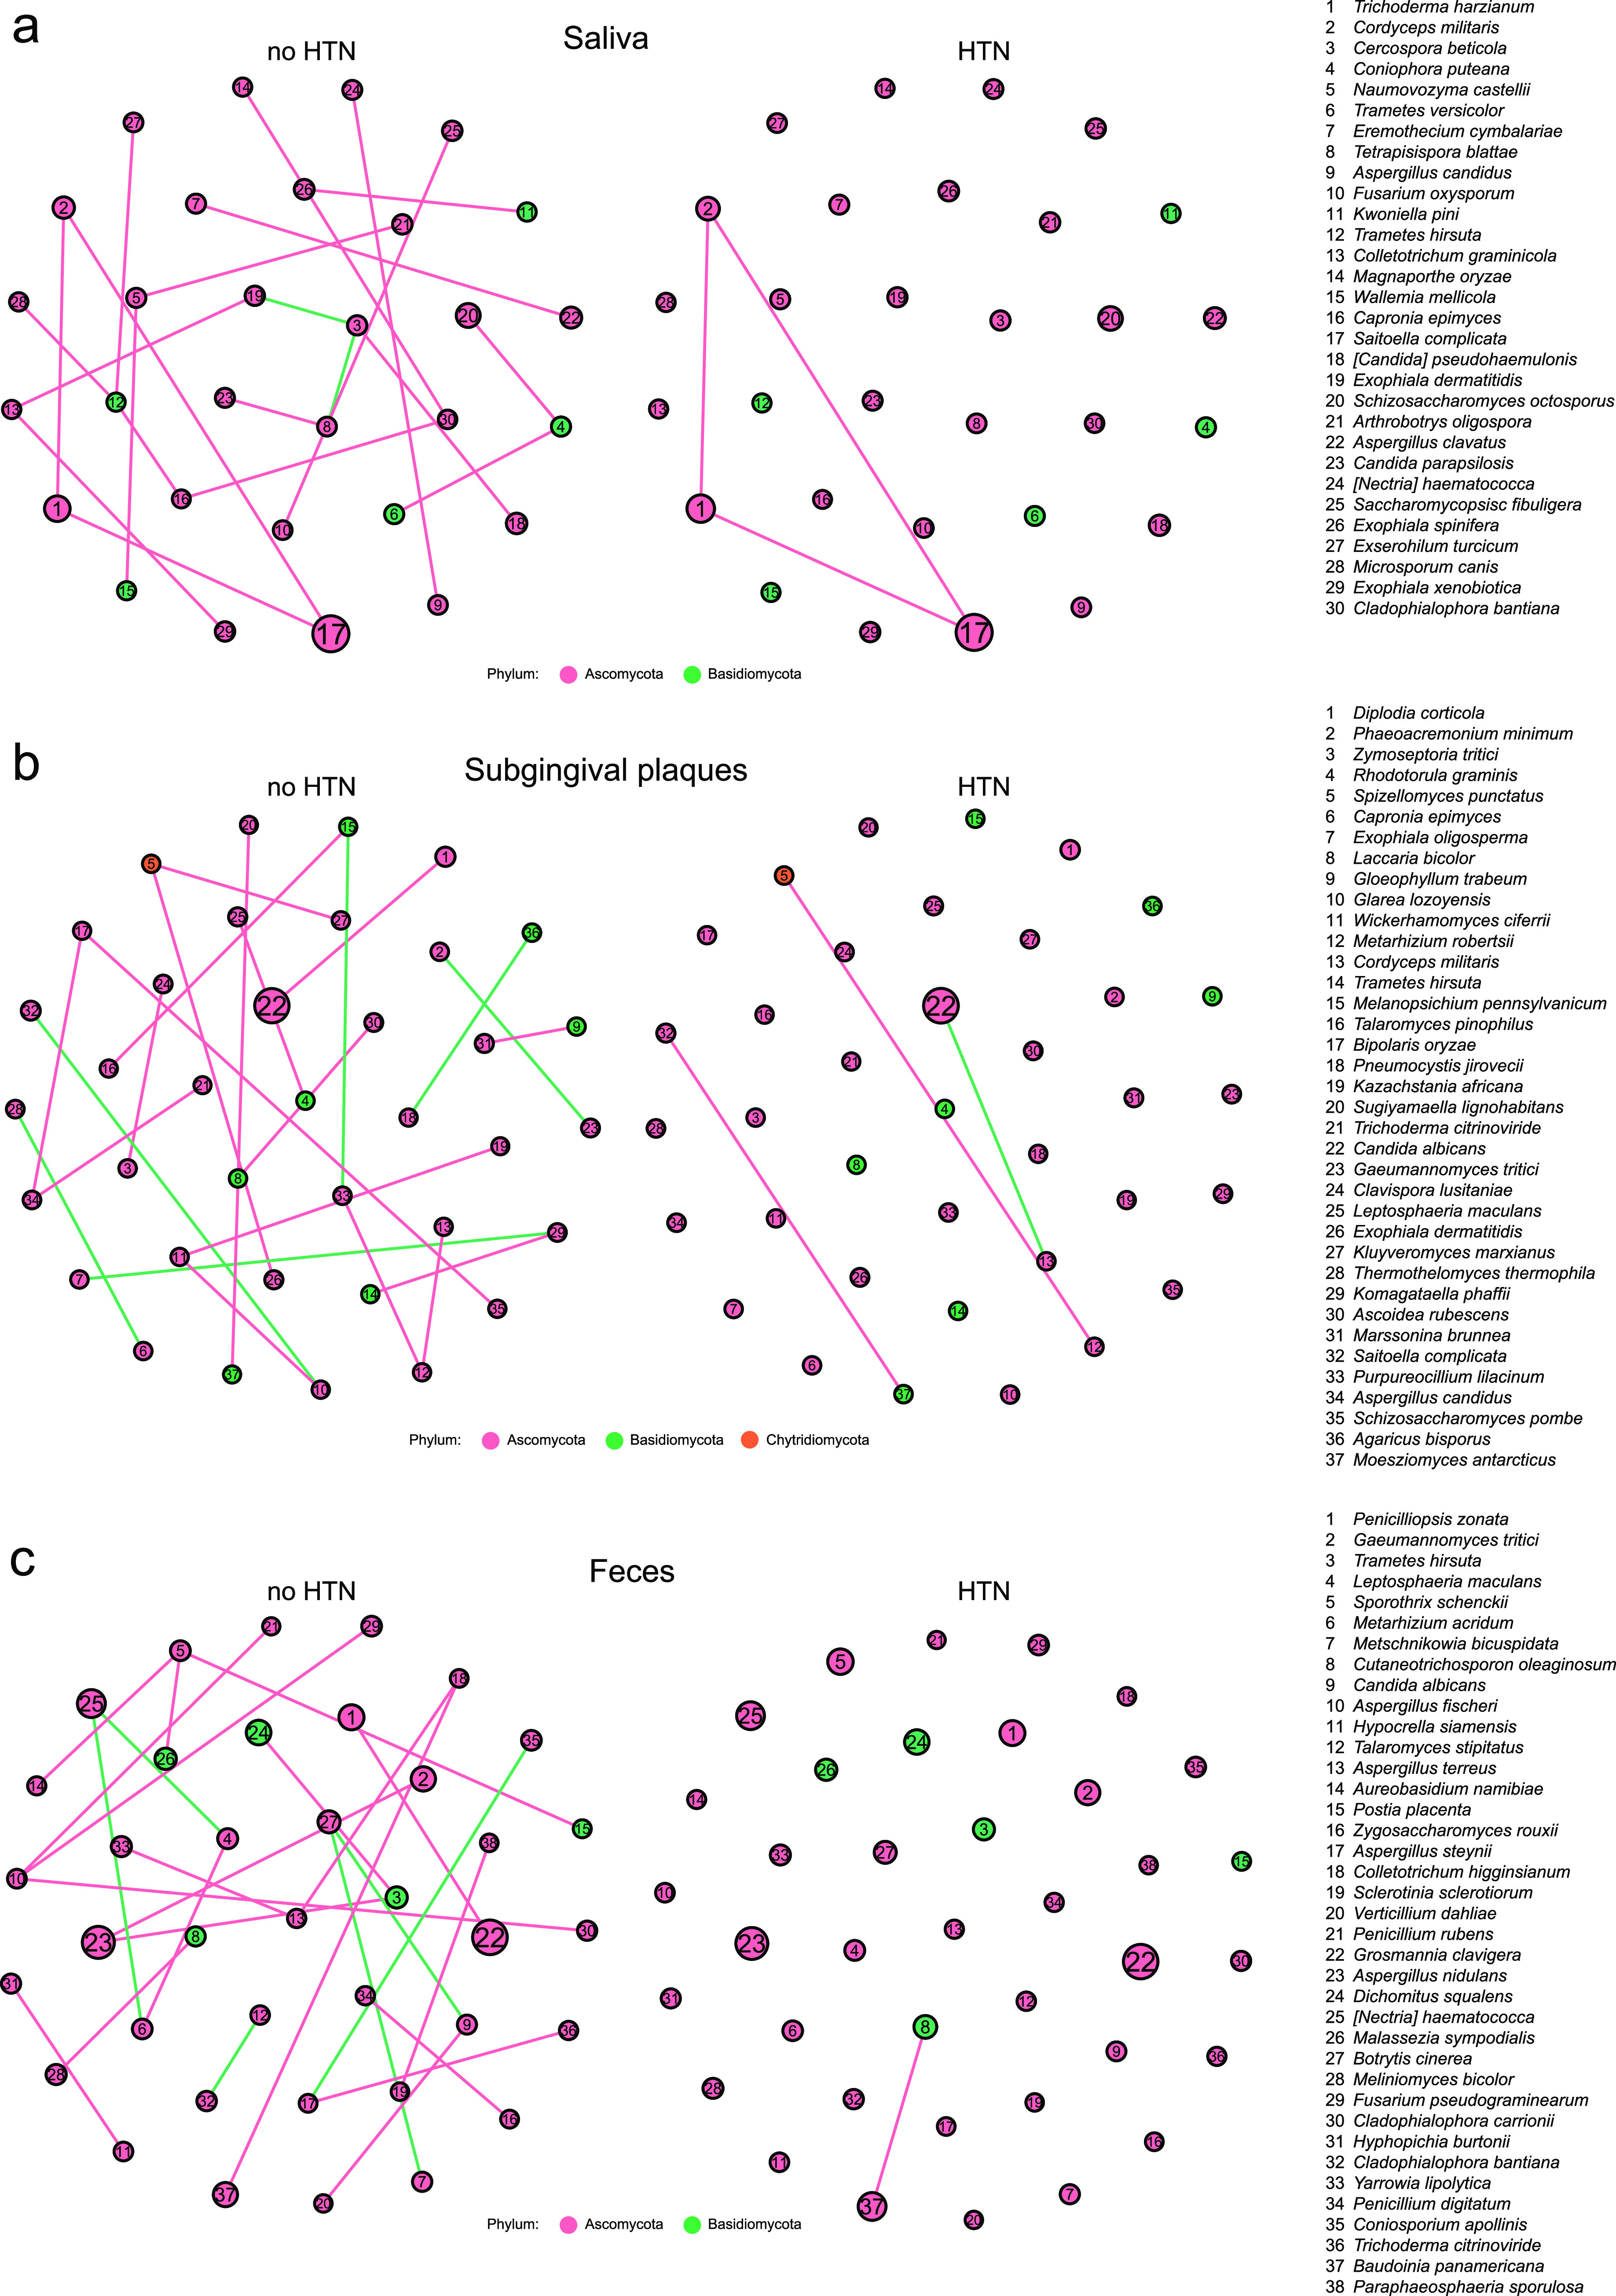
FIG 5.

Different cocorrelation networks of predominant oral and gut fungal species between the no-HTN and HTN groups for saliva (a), subgingival plaques (b), and feces (c). The size of circles indicates the relative abundance of fungi. Pink and green lines indicate positive and negative correlations, respectively. The top 50 most abundant fungal species with r of >0.6 and P of <0.01 by Spearman’s correlation analysis are displayed. n = 24:36 (no HTN:HTN) for all sample types.
