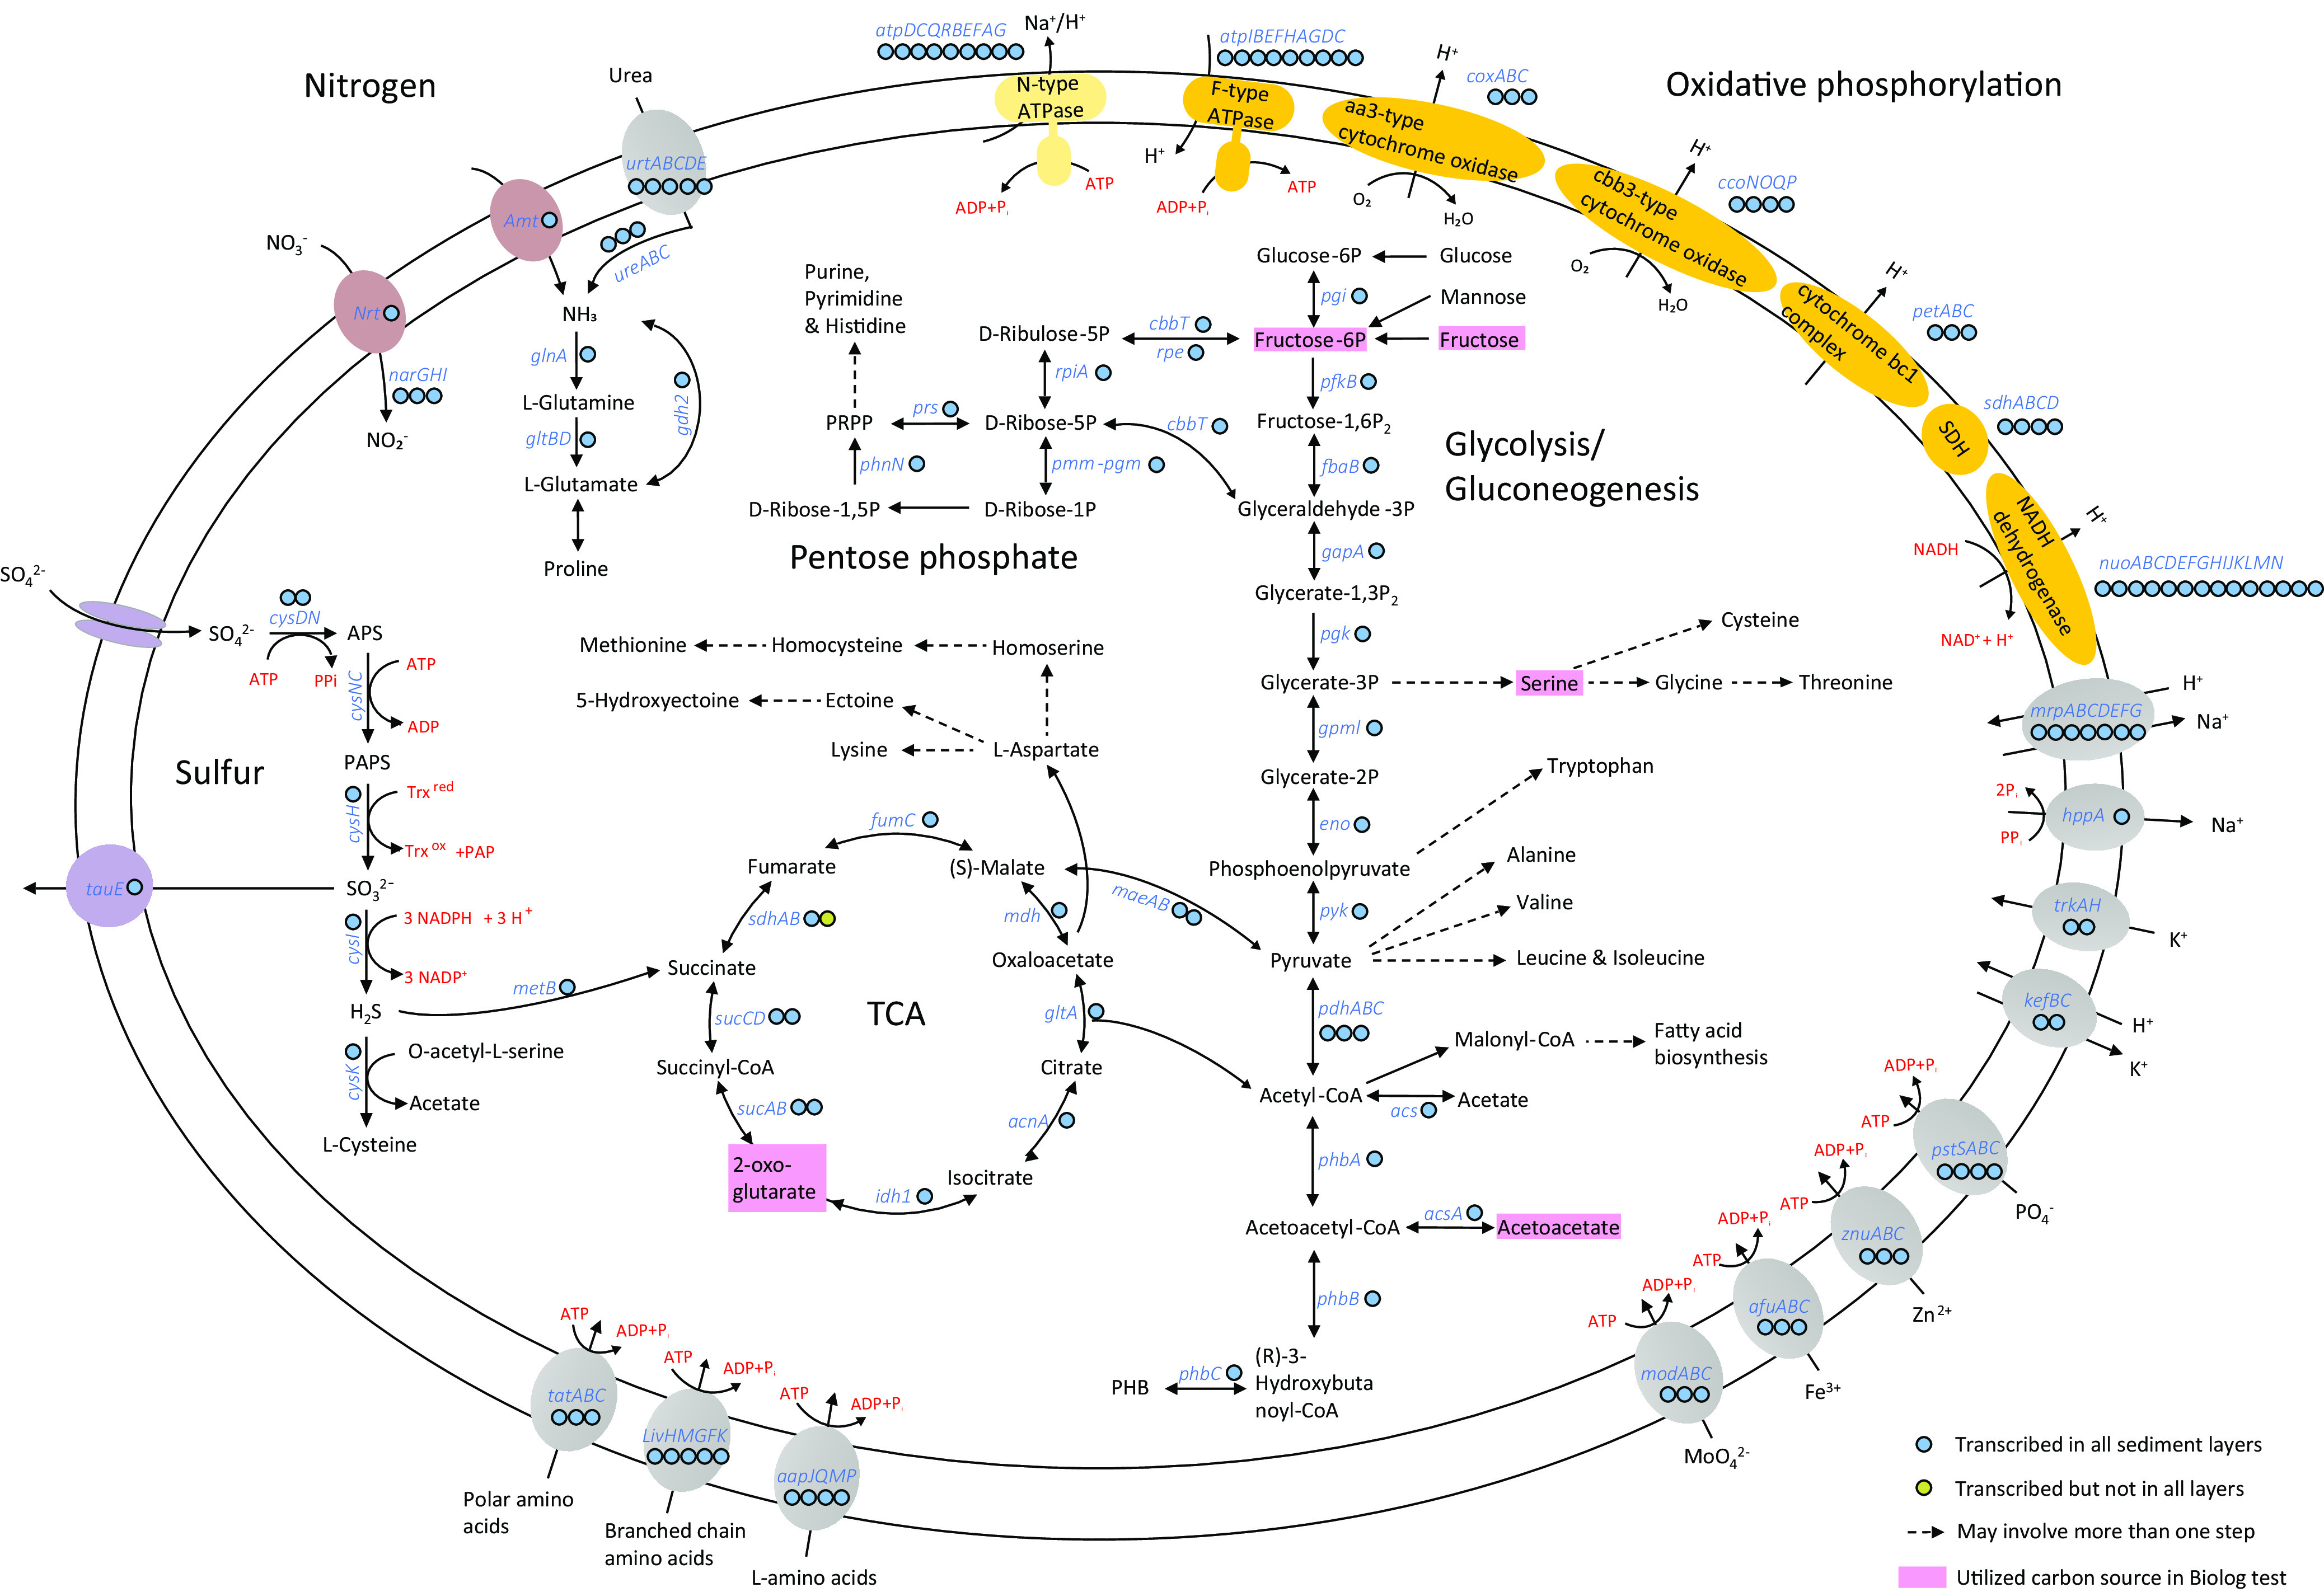
FIG 3.

Metabolic reconstruction of Futiania mangrovii FT118T. Dashed arrows indicate that there may be more than one step in a pathway. Colored circles next to gene symbols indicate whether the genes were expressed in metatranscriptomic data. Detailed TPM values of genes involved in major metabolic pathways and adaptive features are listed in Table S4 in the supplemental material. Pink boxes highlight the carbon sources utilized by FT118T in the Biolog GENIII test.
