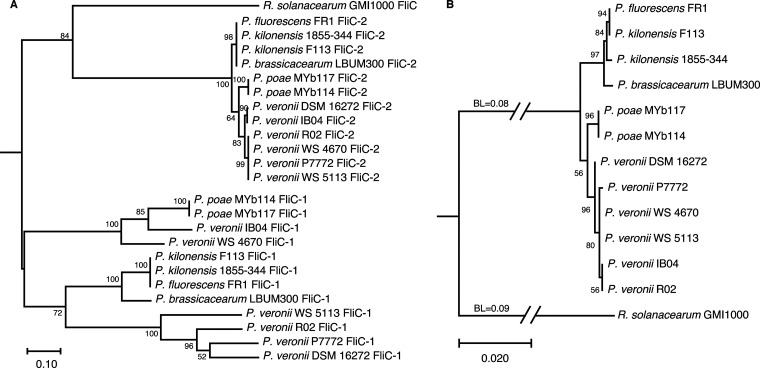
FIG 1.
Phylogenetic analysis of flagellins of Pseudomonas strains. (A) Maximum-likelihood phylogeny based on protein sequence alignments of flagellins from 12 Pseudomonas strains and Ralstonia solanacearum GMI1000. The JTT matrix-based model with 500 bootstrap replicates was used. (B) Maximum-likelihood phylogeny based on 16S rRNA gene sequences from 12 Pseudomonas strains and Ralstonia solanacearum GMI1000. The Tamura–Nei model with 500 bootstrap replicates was used. 16S rRNA gene sequences and flagellin sequences from R. solanacearum GMI1000 were regarded as an outgroup. The numbers at the branches represent the confidence levels of the taxa clustered in the tree. The scale bar reflects evolutionary distance. BL, branch lengths.

