FIG 4.
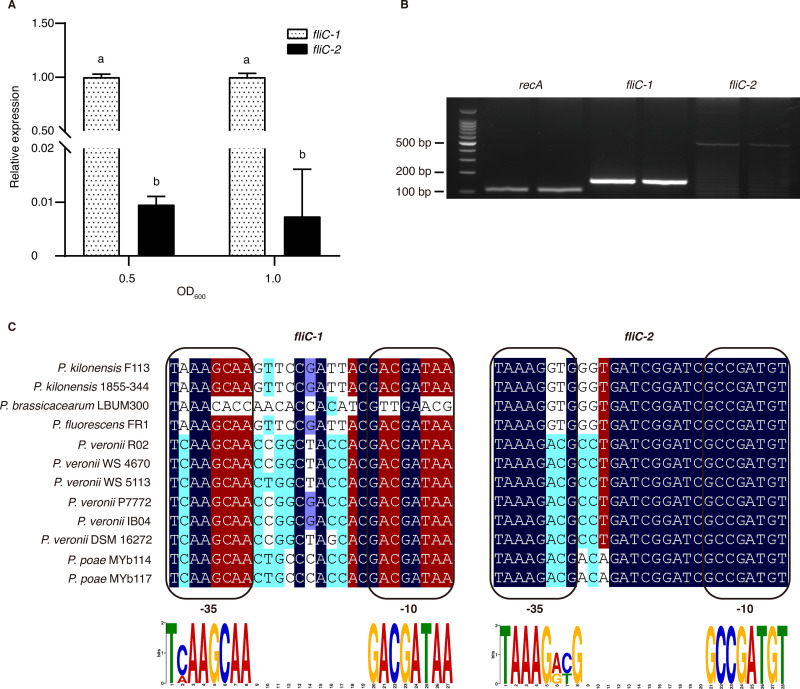
fliC gene expression and promoter prediction. (A) RT-qPCR analysis of fliC-1 and fliC-2 expression in P. kilonensis F113 cultured in KB medium. (B) RT-PCR of fliC-1 and fliC-2 expression in P. kilonensis F113 infiltrated into N. benthamiana. (C) Alignment of the fliC-1 and fliC-2 promoter regions. The -10 and -35 regions for each promoter are indicated in boxes. Dark blue indicates 100% identity, red indicates ≥75% identity, cyan indicates ≥50% identity, and light blue indicates ≥33% identity. The height of each letter in the MEME LOGO represents the relative frequency of each base at different positions in the consensus sequence. Different letters indicate statistically significant differences between different treatments (one-way ANOVA, Tukey’s test; P < 0.05). All experiments were repeated three times with similar results.

