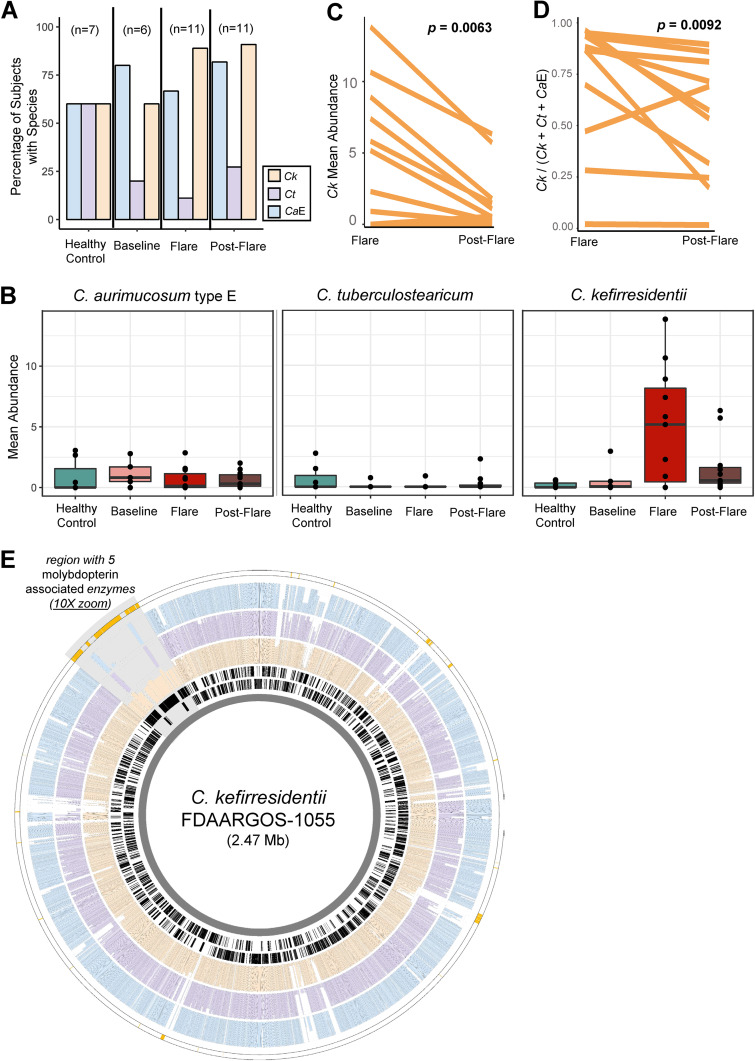
FIG 3.
Increase in C. kefirresidentii relative abundance in metagenomes sampled during atopic dermatitis flares. (A) The percentage and (B) abundance of subjects featuring C. kefirresidentii (Ck), C. tuberculostearicum (Ct), and C. aurimucosum type E (CaE) is shown for each AD disease state as well as healthy controls. Species abundance was calculated from averaging abundance of individual metagenomes across body-sites for each subject from the Byrd et al. (22) data set. (C) Changes in the StrainGST estimated relative abundance of Ck and (D) a statistic which measures the relative abundance of Ck to Ct and CaE based on read alignment and coverage measurement of species-specific alleles along the core genome of the species complex is shown between paired flare and postflare surveys. (E) Genomic location of homolog groups identified as enriched in C. kefirresidentii genomes relative to C. tuberculostearicum and C. aurimucosum type E genomes along the chromosome of C. kefirresidentii FDAARGOS_1055 is shown as the outermost track in gold. The most inner two rings in black show the location of coding genes on the reverse and forward strands. The following rings (from inner to outer) show the conservation of homologs of the gene in C. kefirresidentii (orange), C. tuberculostearicum (purple), and C. aurimucosum type E (blue) genomes. The colocated set of genes found to be conserved in 80% of C. kefirresidentii featuring five molybdopterin associated enzymes is highlighted in gray and zoomed in at 10×.

