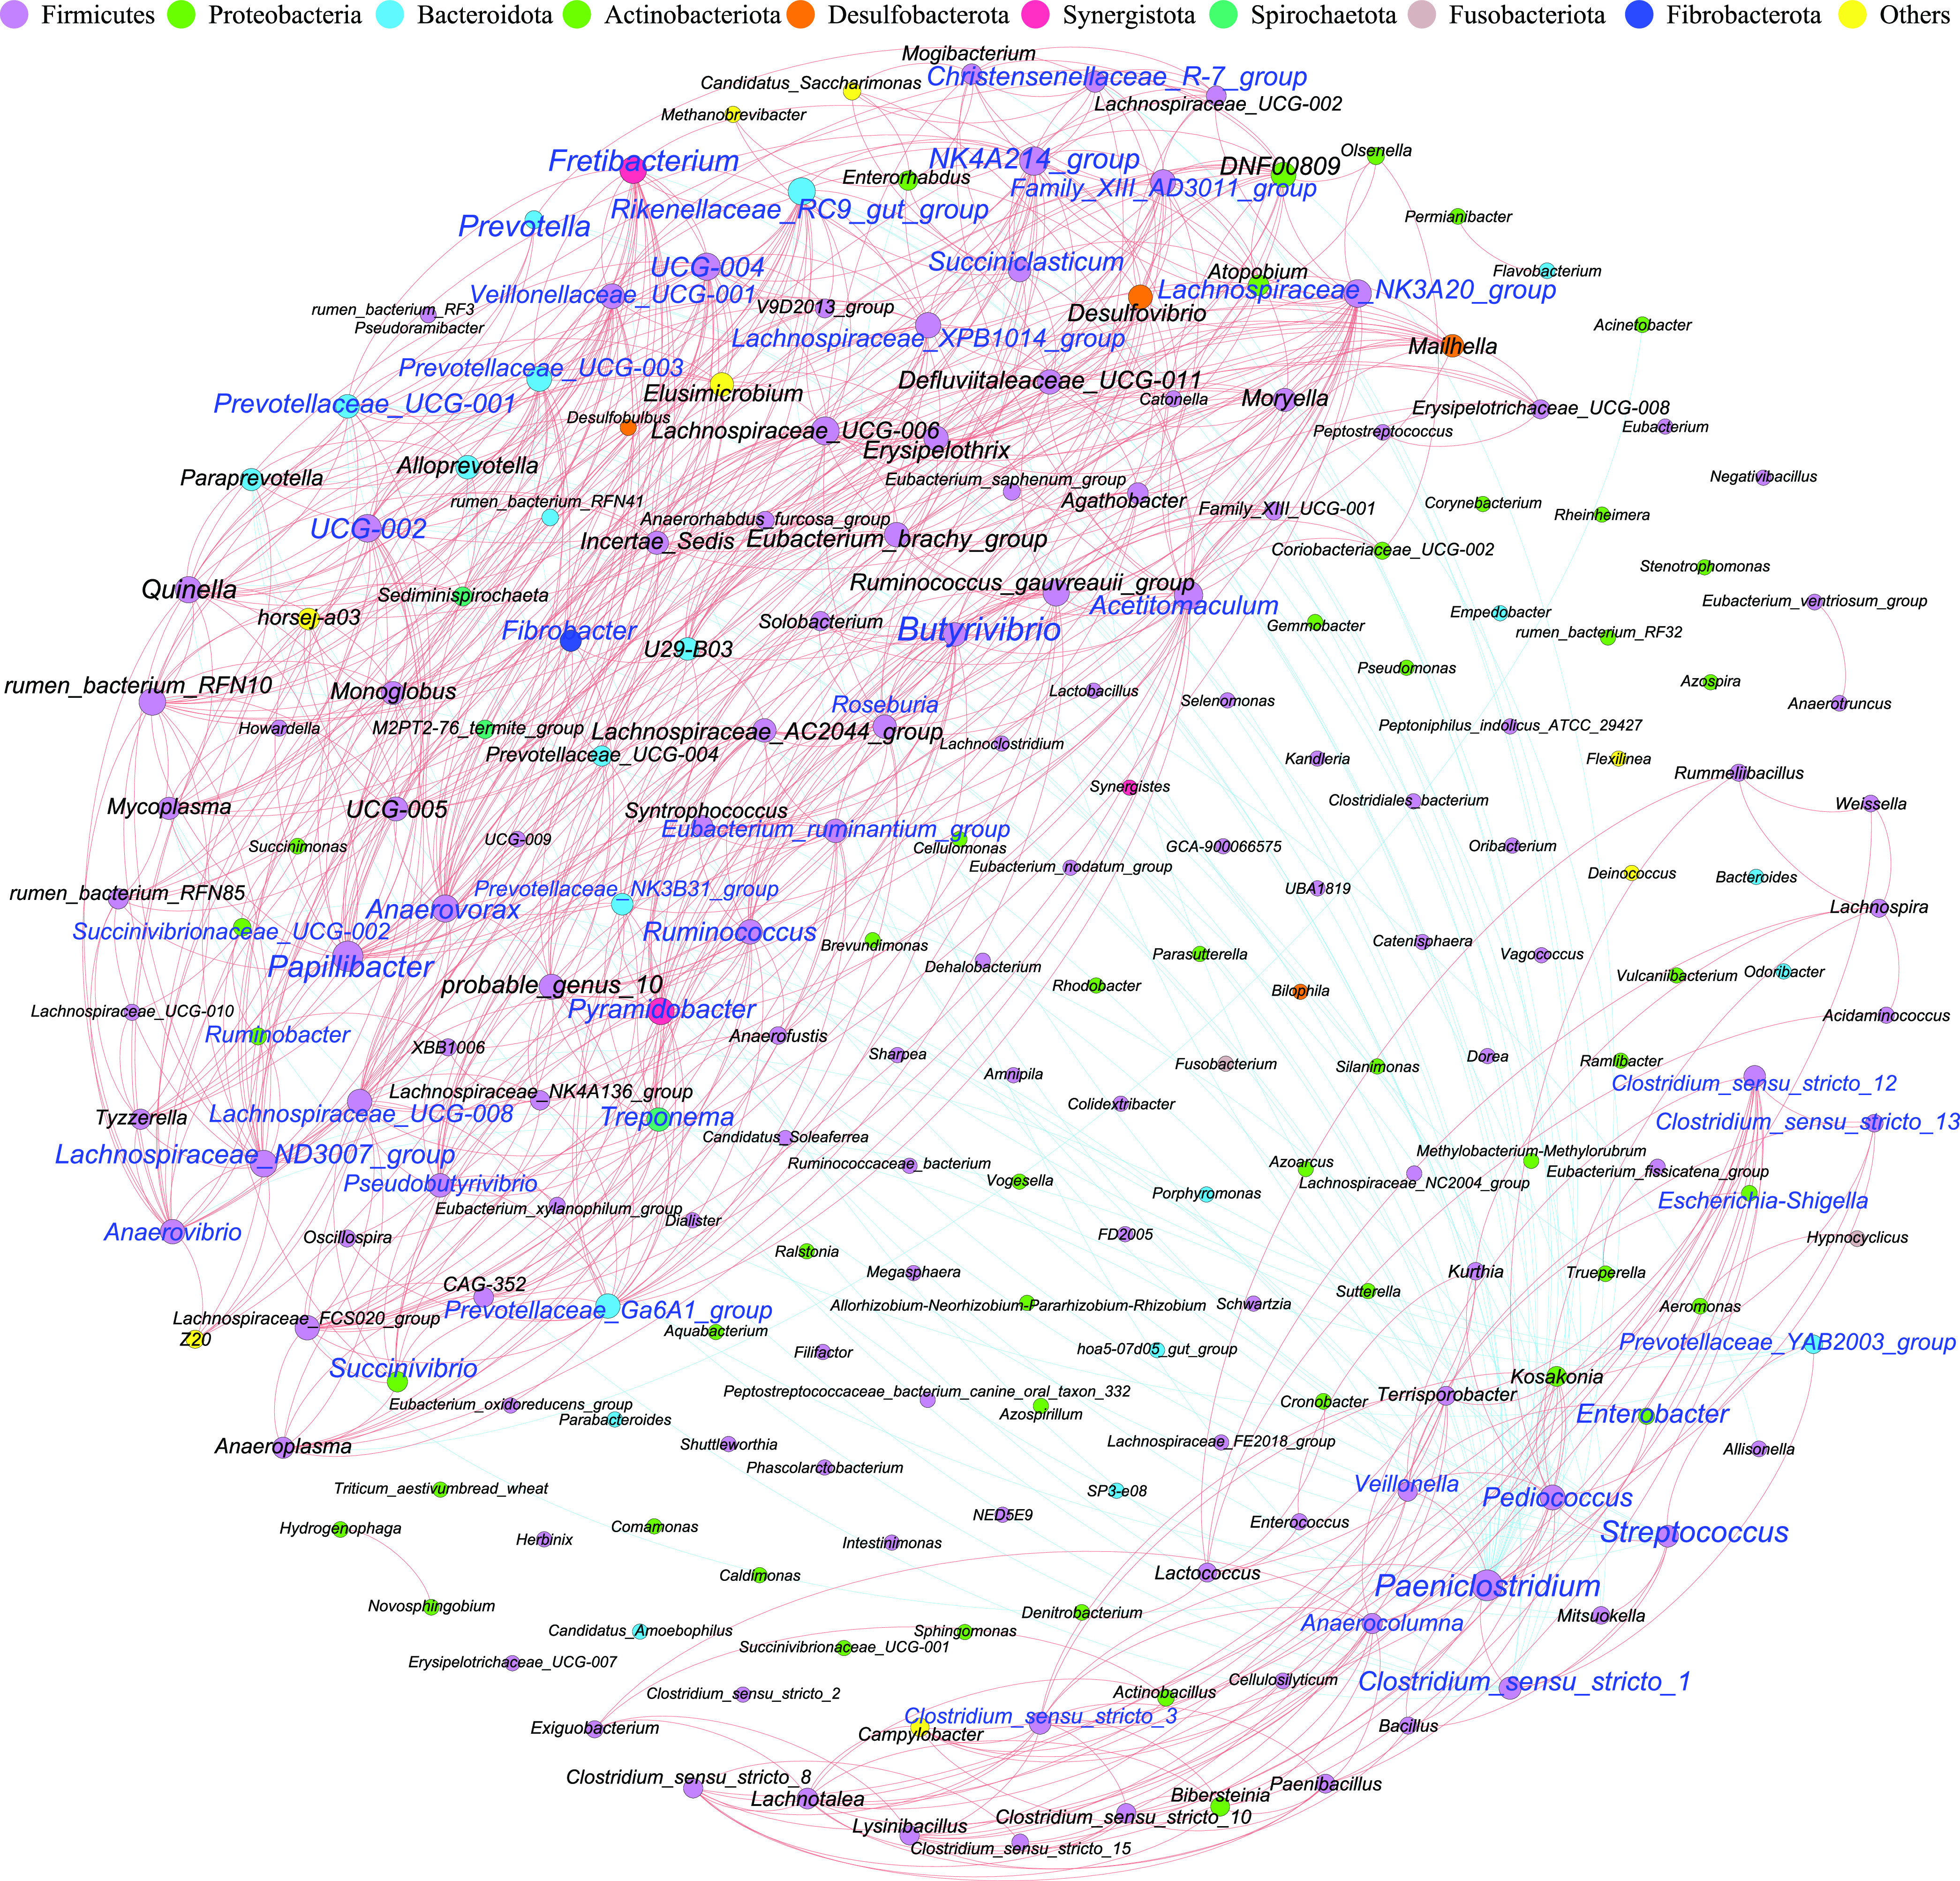
FIG 5.

Network analysis to classify bacterial interactions. The network analysis showed the degree of correlation between the bacteria at the genus-wide level (Spearman’s |r| > 0.7 and P < 0.05). The nodes represent the phylum classification of the genus, and the node sizes represent the weights of each taxon. Nodes representing the same phylum are shown in the same color. Lines between two genus-level bacteria represent the correlation, with a red line indicating a positive correlation, a blue line indicating a negative correlation, and the line size indicating the magnitude of the correlation. Blue represents the featured taxa of different groups with a LDA score of >3.
