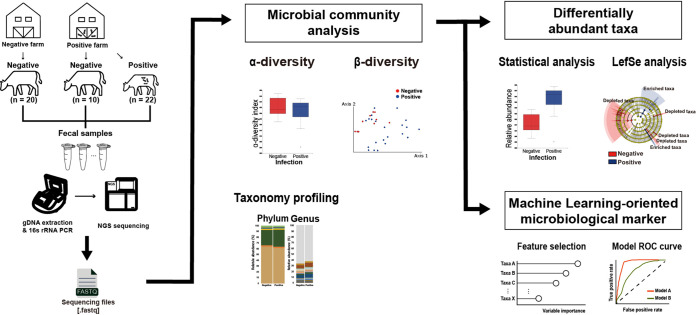
FIG 1.
Overview of the analysis. The experiment was conducted using fecal samples from 52 cattle (negative, 30; positive, 22) divided into two groups by MAP infection. Microbial diversities (alpha and beta) and taxonomy profiles of the microbiotas in all samples were explored and compared by group. To determine the microbial features associated with MAP infection, significantly different taxa were identified by statistical analysis and LEfSe analysis based on the relative abundances of each taxon. Several taxa that contributed to classifying MAP infection were selected using dimensionality reduction tools, and their discriminating potential for the MAP infection classifier was validated using ROC curve analysis.

