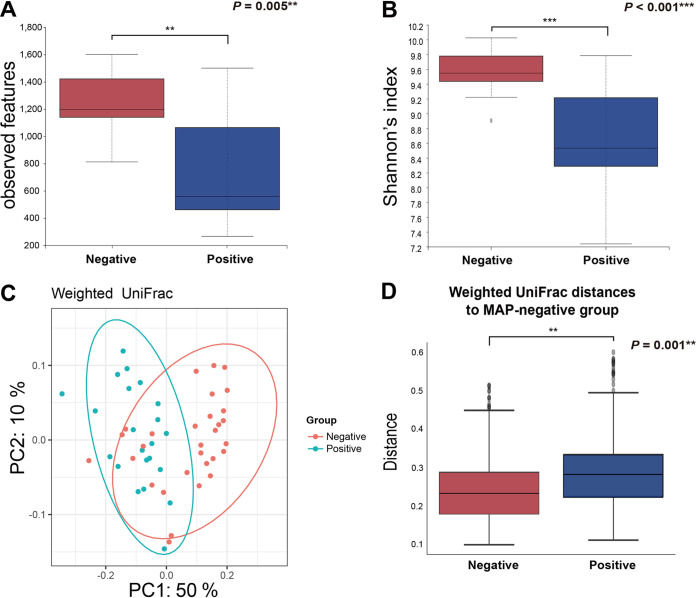
FIG 2.
Changes in microbial diversity indices of fecal microbiotas by MAP infection. (A and B) Alpha diversity indices for richness (A) (observed features) and diversity (B) (Shannon’s index). (C and D) Beta diversity indices based on weighted UniFrac distances visualized in the form of PCoA plots that demonstrate significant differences by their distances from each sample between groups.

