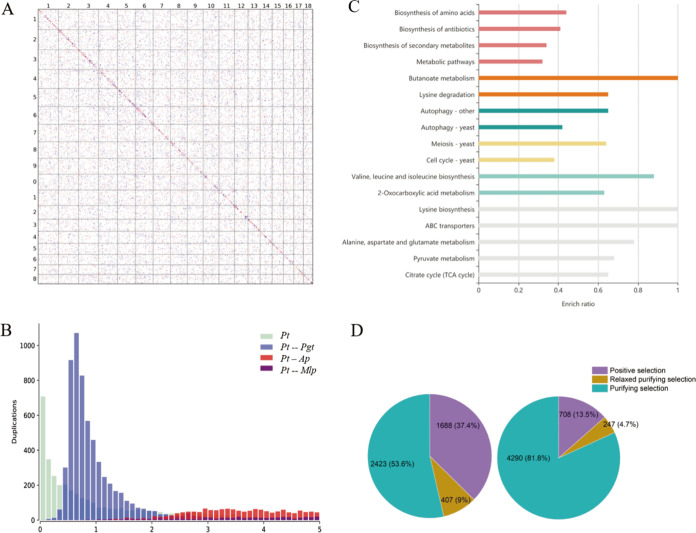
FIG 4.
Gene duplication and evolution. (A) Dot plots showing gene duplicates in P. triticina. Chromosome numbers are shown. Best hits, secondary hits, and other hits are shown in red, blue, and gray, respectively. (B) Ks distribution for paralogues in P. triticina and orthologues in P. triticina and other rust species. (C) Bar plot of KEGG pathway enrichment for P. triticina genes after P. triticina-P. graminis divergence. TCA, tricarboxylic acid. (D) Distribution of Ka/Ks ratios for paralogues in P. triticina. (Left) After P. triticina-P. graminis divergence; (right) before P. triticina-P. graminis divergence. Positive selection, relaxed purifying selection, and purifying selection represent Ka/Ks > 1, 0.8 < Ka/Ks < 1, and Ka/Ks ≤ 0.8, respectively.

