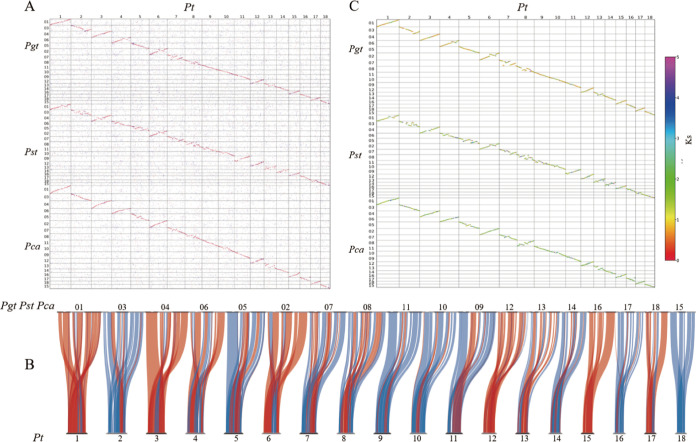
FIG 5.
(A) Dot plots showing homologous genes in P. triticina-P. graminis, P. triticina-P. striiformis f. sp. tritici, and P. triticina-P. coronata f. sp. avenae. Best hits, secondary hits, and other hits are shown in red, blue, and gray, respectively. (B) Gene synteny in P. triticina-P. graminis, P. triticina-P. striiformis f. sp. tritici, and P. triticina-P. coronata f. sp. avenae. Syntenic blocks containing at least 10 genes are shown. Regular chromosomes are in blue and reversed chromosomes are in red. (C) Ks distribution of gene pairs between syntenic blocks. The median value is shown to represent the Ks distribution of the blocks containing at least 10 gene pairs. Chromosome numbers are shown for the four species.

