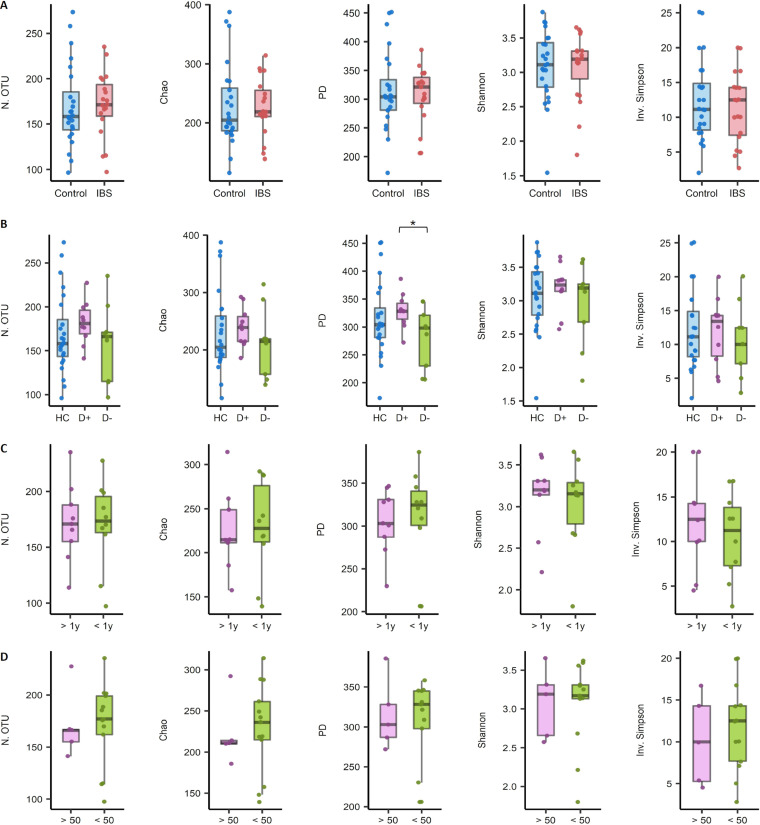
FIG 1.
Differences in the microbial α-diversity indices in stool samples between groups. (A) Irritable bowel syndrome (IBS) patients (n = 19) versus healthy controls (HCs; n = 24). (B) HCs (n = 24) versus IBS patients with diarrhea (n = 10) versus those without diarrhea (n = 9). (C) Patients morbid above a year (n = 9) versus below a year (n = 10). (D) Calprotectin levels above (n = 5) versus below (n = 13) 50 mg/kg. unadjusted *, P < 0.05. N.OTU, number of operational taxonomic units; PD, phylogenetic diversity; Inv. Simpson, inverse Simpson’s index; D+, IBS with diarrhea; D−, IBS without diarrhea.

