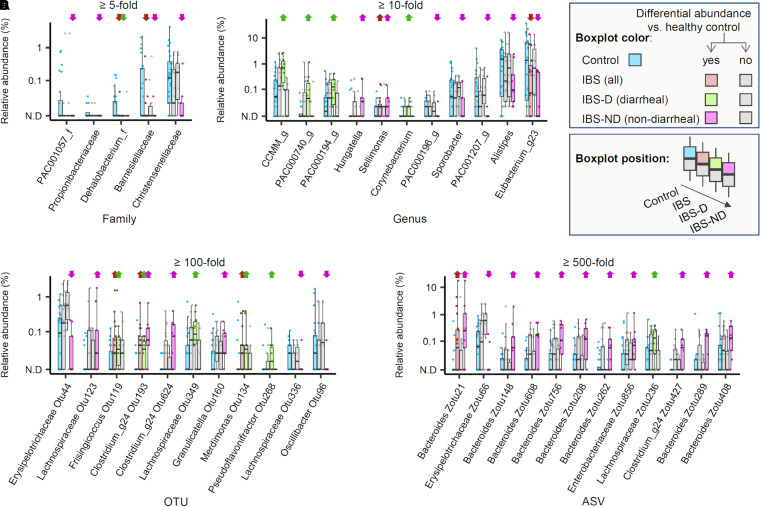
FIG 4.
Relative abundance of bacterial taxa in the stool samples obtained from irritable bowel syndrome patients and healthy controls. Four box plots are shown, representing the range of the relative abundance values of each taxon across individual samples in healthy control (HC), irritable bowel syndrome (IBS), diarrheal IBS (IBS-D), and nondiarrheal IBS (IBS-ND) subjects. The color scheme was used to aid distinction among the sample groups as well as the cases with significant differences (see the visual legend inside the figure). Significance was tested for a given taxon by performing t test and Wilcoxon ranked sum test for comparisons between the healthy control group and each IBS category. A taxon was considered to be differentially abundant when the fold difference of abundance between the groups was above a certain threshold (5-fold for families, 10-fold for genera, 100-fold for operational taxonomic units [OTUs], and 500-fold for amplicon sequence variants [ASVs], adjusted for each rank to control the number of taxa to visualize), and P < 0.05 from t test or Wilcoxon test. Upward and downward arrows are placed above the taxon in the given patient group. These indicate the relative enrichment and depletion, respectively, compared with abundance in HCs. Panel A-D show the selected families (A), genera (B), OTUs (C), and ASVs (D).

