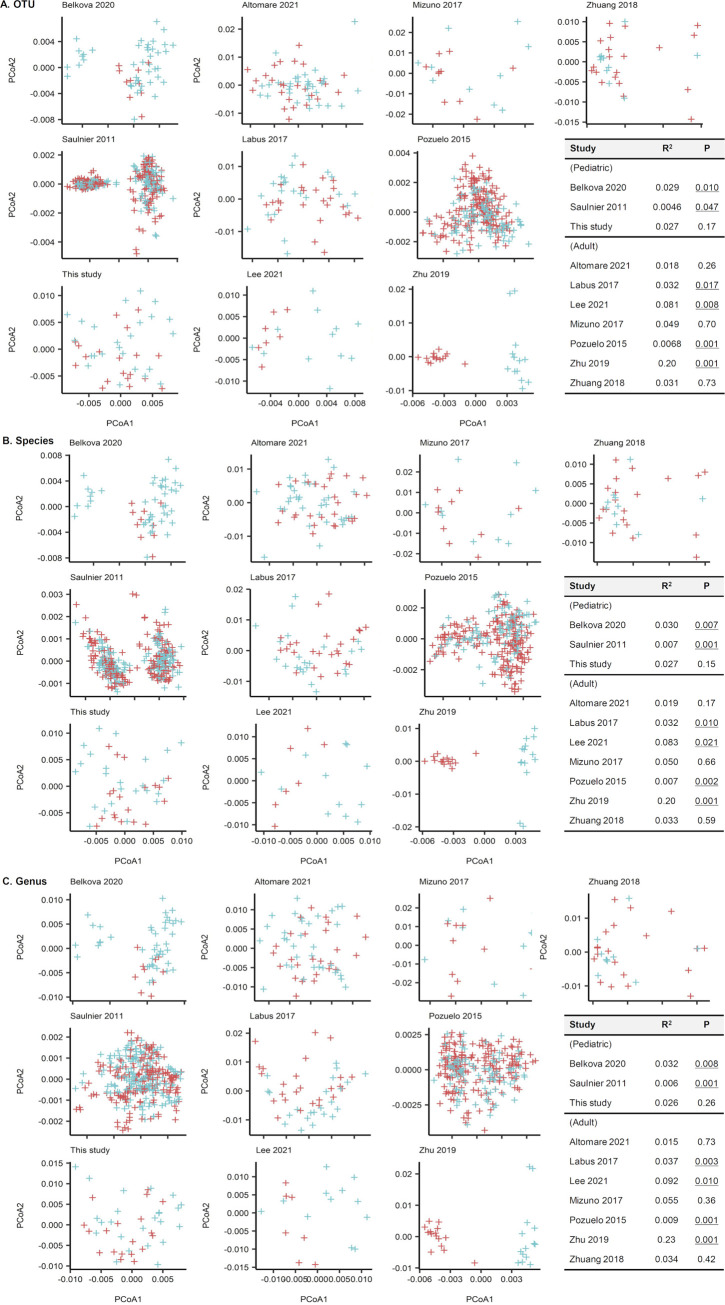
FIG 6.
Stool microbiota comparison of 10 cohorts using principle coordinates analysis and Adonis tests with Aitchison distances. (A) Operational taxonomic unit-level compositions. (B) Species-level compositions. (C) Genus-name compositions. A few data sets showed significantly different distributions between patients with irritable bowel syndrome (IBS) and healthy controls (HC) (P values that are below 0.05 are presented underlined in the inserted table). However, the correlation was low (R2 < 0.20) except for the Zhu et al. 2019 data set (6) (R2 = 0.20).

