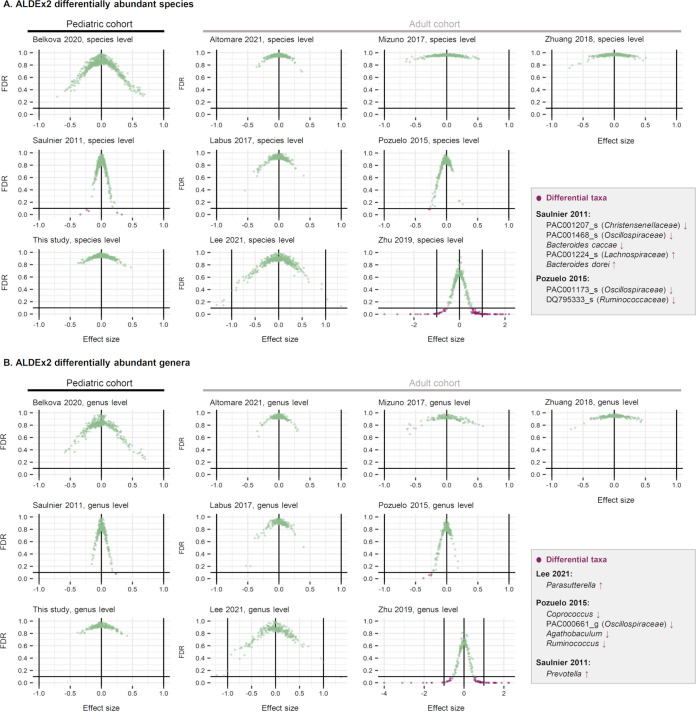
FIG 7.
Differentially abundant microbial taxa at the species (A) and genus (B) levels were determined using the ALDEx2 method. Each scatterplot displays the effective size (x axis) and false discovery rate (FDR; y axis) determined for each individual taxon. The data points located in the lower left area of the plot (i.e., those with FDR below 0.1 line and negative effective size) represent the taxa significantly depleted in IBS, while the data points located in the lower right area represent the taxa significantly enriched in IBS. The names of the taxa enriched or depleted in the IBS are shown in the text boxes. The Zhu et al. 2019 data set (6) had multiple taxa that passed the differential abundance criteria; Therefore, we concluded the data set to be an outlier and excluded it from the analysis.

