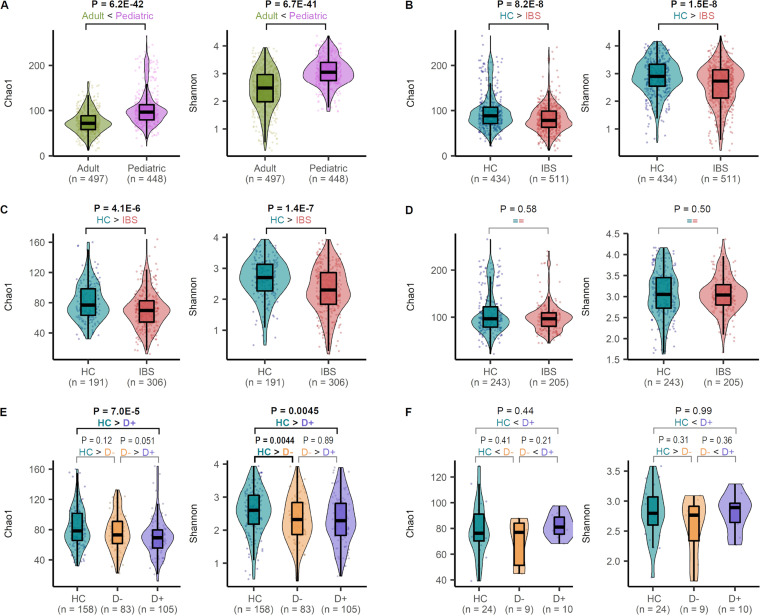
FIG 8.
Comparison of α-diversity in irritable bowel syndrome (IBS) patients and healthy controls (HCs). The box plots show the median and interquartile range of Chao1 index and Shannon index for subjects, as defined in the x axis. Individual data points and violin plots are shown to display the distribution of the values. The Chao1 and Shannon indices were calculated from the operational taxonomic unit tables after rarefying the number of reads to 1,000. P values determined by the Wilcoxon test are displayed over the groups in bold when P < 0.05. (A) Comparison between the pediatric and adult subjects after pooling the samples across all cohorts. (B) Comparison between HC and IBS patients. (C) Comparison between HC and IBS within the adult cohorts. (D) Comparison between HC and IBS within the pediatric cohorts. (E) Comparing HC, IBS with diarrhea, and IBS without diarrhea within the adult cohorts. (F) Comparison among HC, IBS with diarrhea, and IBS without diarrhea within the pediatric cohort. D+, IBS with diarrhea; D−, IBS without diarrhea.

