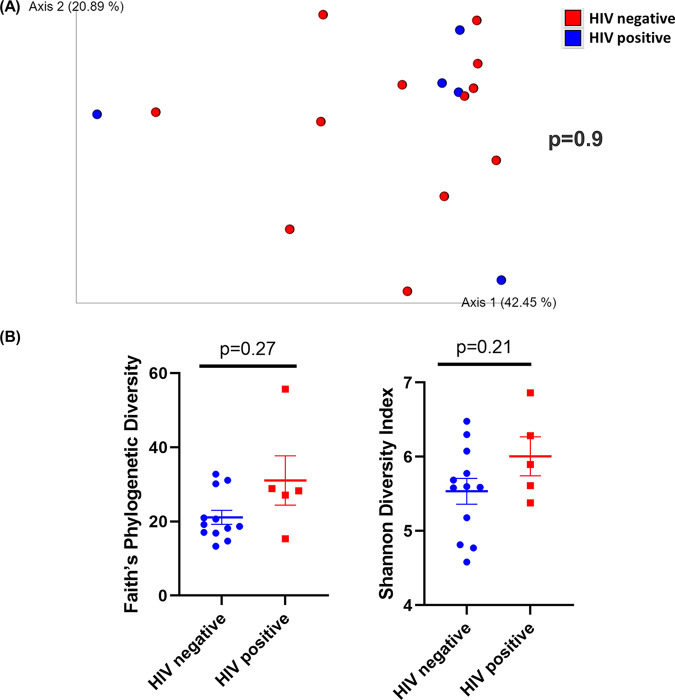
FIG 7.
Diversity analysis of the saliva samples. (A) Principal-coordinate analysis (PCoA) plot of weighted UniFrac distances (metrics of β-diversity). Samples grouped by HIV-negative (n = 12) and -positive (n = 5) status; P = 0.9. (B) Faith’s phylogenic diversity and Shannon diversity index (metrics of α-diversity) at a sequencing depth of 80,000 reads. Samples grouped by HIV-negative (n = 12) and -positive (n = 5) status. Error bars represent SEM.

