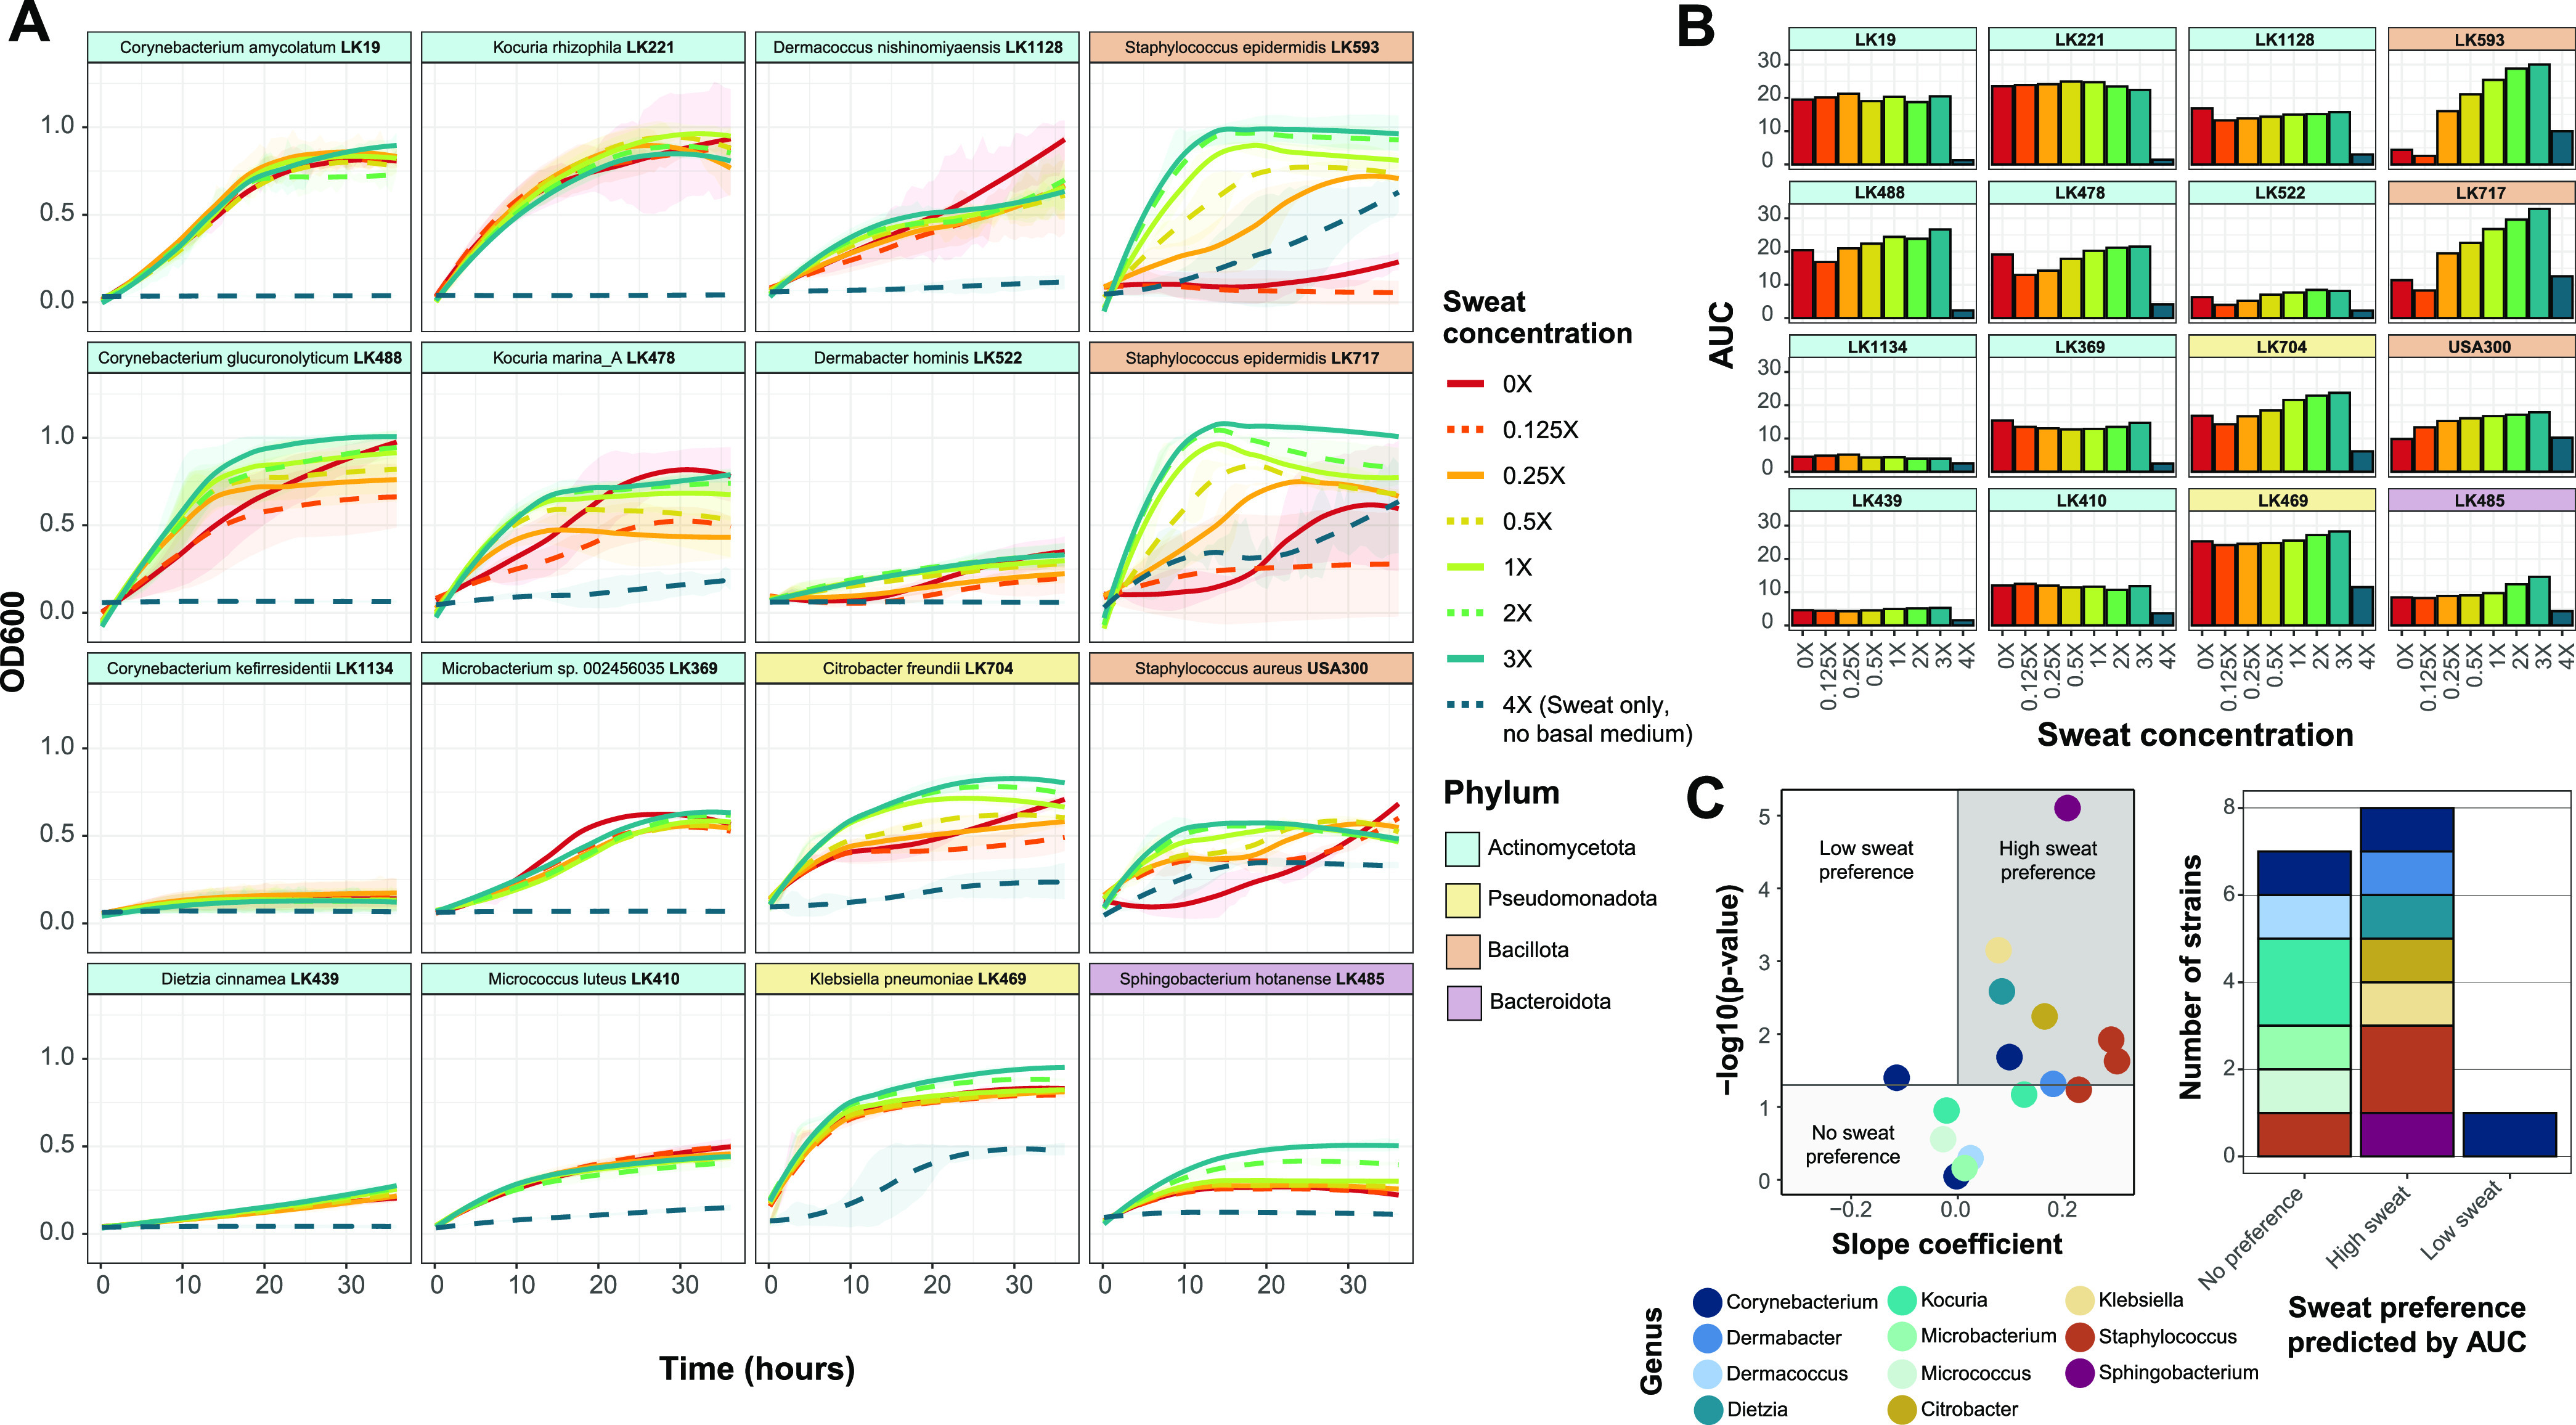
FIG 2.

Skin species exhibit concentration-dependent growth in artificial sweat. (A) For each strain, growth curves were collected at eight concentrations of artificial sweat medium over 36 h. Strains are ordered by phylum-level taxonomic assignment. The 0× sweat medium contains only basal medium, and 4× sweat contains only artificial sweat. Curves were generated using LOESS for averaged OD600 values from at least 2 biological replicates with 3 technical replicates each. Ribbons represent the standard deviations across biological replicates. (B) The area under the curve (AUC) was calculated for each strain and each artificial sweat concentration. The strain order is identical to that in panel A. (C) Linear regression was performed with minimum-maximum-normalized AUC data. For each strain, the slope coefficient (β) and P values for the model are plotted. Strains are classified into sweat preference based on the following coefficient and P value cutoffs: low-sweat preference at a β value of <0 and a P value of <0.05, high-sweat preference at a β value of >0 and a P value of <0.05, and no sweat preference at a P value of >0.05.
